29
/pt/
pt
AIzaSyAYiBZKx7MnpbEhh9jyipgxe19OcubqV5w
April 1, 2024
29546
East Asia & Pacific (IDA & IBRD countries)
TEA
false
2
1
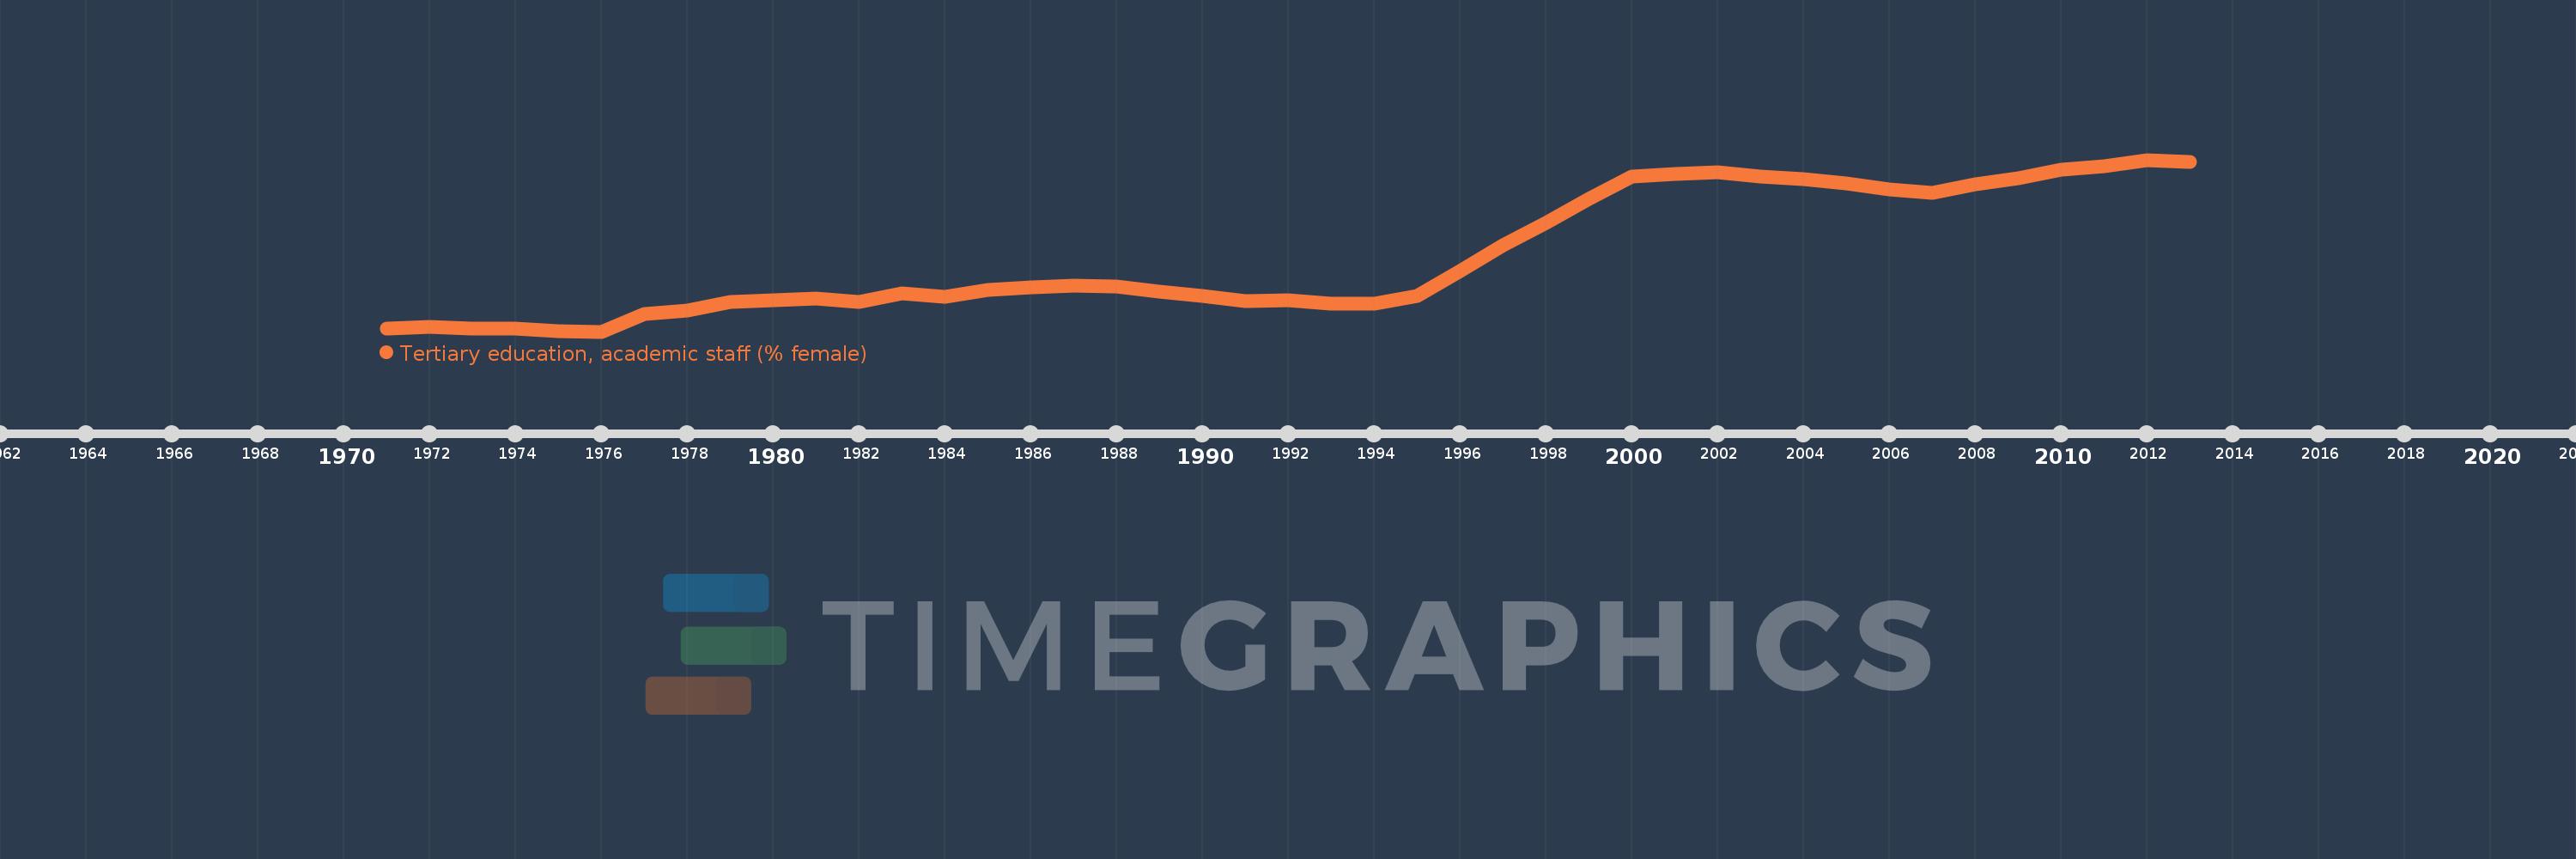
Tertiary education, academic staff (% female)
2013,2012,2011,2010,2009,2008,2007,2006,2005,2004,2003,2002,2001,2000,1999,1998,1997,1996,1995,1994,1993,1992,1991,1990,1989,1988,1987,1986,1985,1984,1983,1982,1981,1980,1979,1978,1977,1976,1975,1974,1973,1972,1971
Estas estatísticas em outros países:
AfghanistanAlbaniaAlgeriaAndorraAngolaAntigua and BarbudaArab WorldArgentinaArmeniaArubaAustraliaAustriaAzerbaijanBahamas, TheBahrainBangladeshBarbadosBelarusBelgiumBelizeBeninBermudaBhutanBoliviaBosnia and HerzegovinaBotswanaBrazilBritish Virgin IslandsBrunei DarussalamBulgariaBurkina FasoBurundiCabo VerdeCambodiaCameroonCanadaCaribbean small statesCayman IslandsCentral African RepublicCentral Europe and the BalticsChadChileChinaColombiaComorosCongo, Dem. Rep.Congo, Rep.Costa RicaCote d'IvoireCroatiaCubaCyprusCzech RepublicDenmarkDjiboutiDominicaDominican RepublicEarly-demographic dividendEast Asia & PacificEast Asia & Pacific (excluding high income)East Asia & Pacific (IDA & IBRD countries)EcuadorEgypt, Arab Rep.El SalvadorEquatorial GuineaEritreaEstoniaEthiopiaEuro areaEurope & Central AsiaEurope & Central Asia (excluding high income)Europe & Central Asia (IDA & IBRD countries)European UnionFijiFinlandFragile and conflict affected situationsFranceGabonGambia, TheGeorgiaGermanyGhanaGreeceGrenadaGuineaGuyanaHaitiHeavily indebted poor countries (HIPC)High incomeHondurasHong Kong SAR, ChinaHungaryIBRD onlyIcelandIDA & IBRD totalIDA blendIDA onlyIDA totalIndiaIndonesiaIran, Islamic Rep.IraqIrelandItalyJamaicaJapanJordanKazakhstanKorea, Dem. People’s Rep.Korea, Rep.KuwaitKyrgyz RepublicLao PDRLate-demographic dividendLatin America & Caribbean Latin America & Caribbean (excluding high income)Latin America & the Caribbean (IDA & IBRD countries)LatviaLeast developed countries: UN classificationLebanonLesothoLiberiaLibyaLiechtensteinLithuaniaLow & middle incomeLow incomeLower middle incomeLuxembourgMacao SAR, ChinaMacedonia, FYRMadagascarMalawiMalaysiaMaldivesMaliMaltaMarshall IslandsMauritaniaMauritiusMicronesia, Fed. Sts.Middle East & North AfricaMiddle East & North Africa (excluding high income)Middle East & North Africa (IDA & IBRD countries)Middle incomeMoldovaMongoliaMoroccoMozambiqueMyanmarNamibiaNepalNetherlandsNew ZealandNicaraguaNigerNigeriaNorth AmericaNorwayOECD membersOmanOther small statesPacific island small statesPakistanPalauPanamaPapua New GuineaPeruPhilippinesPolandPortugalPost-demographic dividendPre-demographic dividendPuerto RicoQatarRomaniaRussian FederationRwandaSamoaSao Tome and PrincipeSaudi ArabiaSenegalSerbiaSeychellesSierra LeoneSingaporeSint Maarten (Dutch part)Slovak RepublicSloveniaSmall statesSomaliaSouth AfricaSouth AsiaSouth Asia (IDA & IBRD)SpainSri LankaSt. Kitts and NevisSt. LuciaSt. Vincent and the GrenadinesSub-Saharan Africa Sub-Saharan Africa (excluding high income)Sub-Saharan Africa (IDA & IBRD countries)SudanSurinameSwazilandSwedenSwitzerlandSyrian Arab RepublicTajikistanTanzaniaThailandTimor-LesteTogoTongaTrinidad and TobagoTunisiaTurkeyTurkmenistanUgandaUnited Arab EmiratesUnited KingdomUnited StatesUpper middle incomeUruguayUzbekistanVenezuela, RBVietnamWest Bank and GazaWorldYemen, Rep.Zimbabwe Linha do tempo:
Nesta escala de tempo está apresentado um gráfico de 1971 ano até 2013 ano East Asia & Pacific (IDA & IBRD countries). Dados de 1970 ano ausente. O número de observações reais por data: 43.
Fonte (nome):
Indicadores de desenvolvimento mundial
Fonte (organização):
United Nations Educational, Scientific, and Cultural Organization (UNESCO) Institute for Statistics.
Categorias:
Education
Foi atualizado:
23 abr 2017 ano
Indicadores de alterações dos valores ao longo dos anos
Mínimo:
25.873
1 jan 1976 ano
Máximo:
47.098
1 jan 2012 ano
Na data de observação
Valor
Mudança absoluta
A alteração em relação ao valor anterior
1 jan 1971 ano
26.237
+26.237
0.0%
1 jan 1972 ano
26.437
+0.2
0.76%
1 jan 1973 ano
26.279
-0.158
-0.6%
1 jan 1974 ano
26.242
-0.038
-0.14%
1 jan 1975 ano
25.955
-0.286
-1.09%
1 jan 1976 ano
25.873
-0.082
-0.32%
1 jan 1977 ano
28.011
+2.138
8.26%
1 jan 1978 ano
28.496
+0.485
1.73%
1 jan 1979 ano
29.576
+1.079
3.79%
1 jan 1980 ano
29.707
+0.132
0.44%
1 jan 1981 ano
29.988
+0.28
0.94%
1 jan 1982 ano
29.515
-0.473
-1.58%
1 jan 1983 ano
30.567
+1.052
3.56%
1 jan 1984 ano
30.222
-0.345
-1.13%
1 jan 1985 ano
31.001
+0.778
2.58%
1 jan 1986 ano
31.337
+0.336
1.08%
1 jan 1987 ano
31.506
+0.17
0.54%
1 jan 1988 ano
31.442
-0.064
-0.2%
1 jan 1989 ano
30.764
-0.678
-2.16%
1 jan 1990 ano
30.303
-0.461
-1.5%
1 jan 1991 ano
29.659
-0.644
-2.12%
1 jan 1992 ano
29.724
+0.065
0.22%
1 jan 1993 ano
29.359
-0.365
-1.23%
1 jan 1994 ano
29.316
-0.042
-0.14%
1 jan 1995 ano
30.301
+0.984
3.36%
1 jan 1996 ano
33.4
+3.1
10.23%
1 jan 1997 ano
36.534
+3.134
9.38%
1 jan 1998 ano
39.319
+2.784
7.62%
1 jan 1999 ano
42.237
+2.918
7.42%
1 jan 2000 ano
45.036
+2.799
6.63%
1 jan 2001 ano
45.396
+0.36
0.8%
1 jan 2002 ano
45.514
+0.118
0.26%
1 jan 2003 ano
44.998
-0.516
-1.13%
1 jan 2004 ano
44.722
-0.276
-0.61%
1 jan 2005 ano
44.211
-0.511
-1.14%
1 jan 2006 ano
43.448
-0.763
-1.73%
1 jan 2007 ano
43.024
-0.424
-0.98%
1 jan 2008 ano
44.069
+1.045
2.43%
1 jan 2009 ano
44.779
+0.71
1.61%
1 jan 2010 ano
45.923
+1.144
2.55%
1 jan 2011 ano
46.308
+0.385
0.84%
1 jan 2012 ano
47.098
+0.79
1.71%
1 jan 2013 ano
46.817
-0.281
-0.6%
Classificação de países por estatísticas atuais por anos


Comentários: