29
/pt/
pt
AIzaSyAYiBZKx7MnpbEhh9jyipgxe19OcubqV5w
April 1, 2024
35415
Heavily indebted poor countries (HIPC)
HPC
false
2
1
Tertiary education, academic staff (% female)
2015,2014,2013,2012,2011,2010,2009,2008,2007,2006,2005,2004,2003,2002,2001,2000,1999,1998,1997,1996,1995,1994,1993,1992,1991,1990,1989,1988,1987,1986,1985,1984,1983,1982,1981
Estas estatísticas em outros países:
AfghanistanAlbaniaAlgeriaAndorraAngolaAntigua and BarbudaArab WorldArgentinaArmeniaArubaAustraliaAustriaAzerbaijanBahamas, TheBahrainBangladeshBarbadosBelarusBelgiumBelizeBeninBermudaBhutanBoliviaBosnia and HerzegovinaBotswanaBrazilBritish Virgin IslandsBrunei DarussalamBulgariaBurkina FasoBurundiCabo VerdeCambodiaCameroonCanadaCaribbean small statesCayman IslandsCentral African RepublicCentral Europe and the BalticsChadChileChinaColombiaComorosCongo, Dem. Rep.Congo, Rep.Costa RicaCote d'IvoireCroatiaCubaCyprusCzech RepublicDenmarkDjiboutiDominicaDominican RepublicEarly-demographic dividendEast Asia & PacificEast Asia & Pacific (excluding high income)East Asia & Pacific (IDA & IBRD countries)EcuadorEgypt, Arab Rep.El SalvadorEquatorial GuineaEritreaEstoniaEthiopiaEuro areaEurope & Central AsiaEurope & Central Asia (excluding high income)Europe & Central Asia (IDA & IBRD countries)European UnionFijiFinlandFragile and conflict affected situationsFranceGabonGambia, TheGeorgiaGermanyGhanaGreeceGrenadaGuineaGuyanaHaitiHeavily indebted poor countries (HIPC)High incomeHondurasHong Kong SAR, ChinaHungaryIBRD onlyIcelandIDA & IBRD totalIDA blendIDA onlyIDA totalIndiaIndonesiaIran, Islamic Rep.IraqIrelandItalyJamaicaJapanJordanKazakhstanKorea, Dem. People’s Rep.Korea, Rep.KuwaitKyrgyz RepublicLao PDRLate-demographic dividendLatin America & Caribbean Latin America & Caribbean (excluding high income)Latin America & the Caribbean (IDA & IBRD countries)LatviaLeast developed countries: UN classificationLebanonLesothoLiberiaLibyaLiechtensteinLithuaniaLow & middle incomeLow incomeLower middle incomeLuxembourgMacao SAR, ChinaMacedonia, FYRMadagascarMalawiMalaysiaMaldivesMaliMaltaMarshall IslandsMauritaniaMauritiusMicronesia, Fed. Sts.Middle East & North AfricaMiddle East & North Africa (excluding high income)Middle East & North Africa (IDA & IBRD countries)Middle incomeMoldovaMongoliaMoroccoMozambiqueMyanmarNamibiaNepalNetherlandsNew ZealandNicaraguaNigerNigeriaNorth AmericaNorwayOECD membersOmanOther small statesPacific island small statesPakistanPalauPanamaPapua New GuineaPeruPhilippinesPolandPortugalPost-demographic dividendPre-demographic dividendPuerto RicoQatarRomaniaRussian FederationRwandaSamoaSao Tome and PrincipeSaudi ArabiaSenegalSerbiaSeychellesSierra LeoneSingaporeSint Maarten (Dutch part)Slovak RepublicSloveniaSmall statesSomaliaSouth AfricaSouth AsiaSouth Asia (IDA & IBRD)SpainSri LankaSt. Kitts and NevisSt. LuciaSt. Vincent and the GrenadinesSub-Saharan Africa Sub-Saharan Africa (excluding high income)Sub-Saharan Africa (IDA & IBRD countries)SudanSurinameSwazilandSwedenSwitzerlandSyrian Arab RepublicTajikistanTanzaniaThailandTimor-LesteTogoTongaTrinidad and TobagoTunisiaTurkeyTurkmenistanUgandaUnited Arab EmiratesUnited KingdomUnited StatesUpper middle incomeUruguayUzbekistanVenezuela, RBVietnamWest Bank and GazaWorldYemen, Rep.Zimbabwe Linha do tempo:
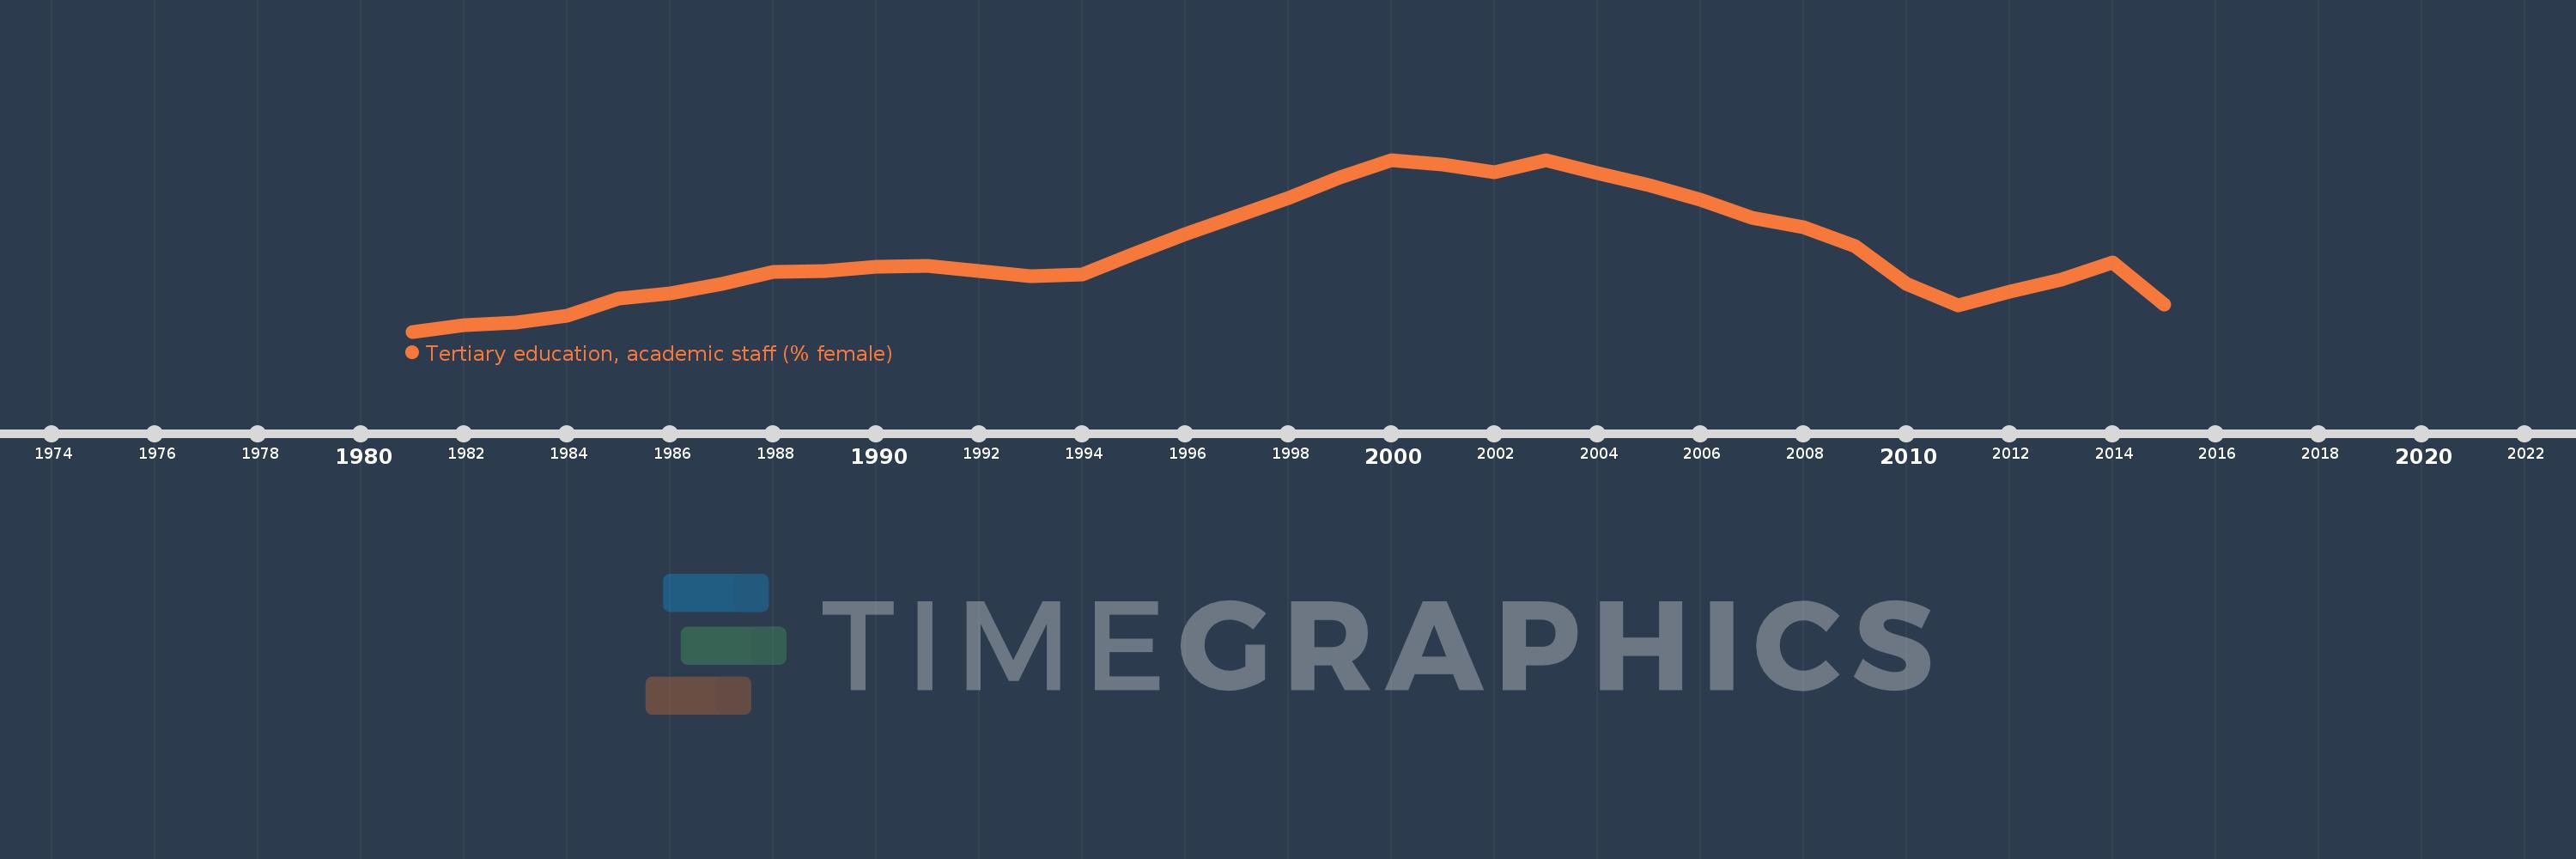
Nesta escala de tempo está apresentado um gráfico de 1981 ano até 2015 ano Heavily indebted poor countries (HIPC). Dados de 1980 ano ausente. O número de observações reais por data: 35.
Fonte (nome):
Indicadores de desenvolvimento mundial
Fonte (organização):
United Nations Educational, Scientific, and Cultural Organization (UNESCO) Institute for Statistics.
Categorias:
Education
Foi atualizado:
23 abr 2017 ano
Indicadores de alterações dos valores ao longo dos anos
Mínimo:
18.129
1 jan 1981 ano
Máximo:
23.364
1 jan 2000 ano
Na data de observação
Valor
Mudança absoluta
A alteração em relação ao valor anterior
1 jan 1981 ano
18.129
+18.129
0.0%
1 jan 1982 ano
18.333
+0.205
1.13%
1 jan 1983 ano
18.416
+0.083
0.45%
1 jan 1984 ano
18.613
+0.197
1.07%
1 jan 1985 ano
19.131
+0.518
2.78%
1 jan 1986 ano
19.295
+0.164
0.86%
1 jan 1987 ano
19.575
+0.279
1.45%
1 jan 1988 ano
19.937
+0.362
1.85%
1 jan 1989 ano
19.973
+0.036
0.18%
1 jan 1990 ano
20.111
+0.138
0.69%
1 jan 1991 ano
20.124
+0.013
0.07%
1 jan 1992 ano
19.973
-0.151
-0.75%
1 jan 1993 ano
19.818
-0.155
-0.77%
1 jan 1994 ano
19.877
+0.059
0.3%
1 jan 1995 ano
20.496
+0.619
3.11%
1 jan 1996 ano
21.108
+0.612
2.99%
1 jan 1997 ano
21.662
+0.554
2.62%
1 jan 1998 ano
22.195
+0.533
2.46%
1 jan 1999 ano
22.826
+0.631
2.84%
1 jan 2000 ano
23.364
+0.538
2.36%
1 jan 2001 ano
23.213
-0.151
-0.65%
1 jan 2002 ano
22.98
-0.233
-1.0%
1 jan 2003 ano
23.358
+0.378
1.65%
1 jan 2004 ano
22.963
-0.395
-1.69%
1 jan 2005 ano
22.592
-0.371
-1.61%
1 jan 2006 ano
22.149
-0.443
-1.96%
1 jan 2007 ano
21.592
-0.557
-2.51%
1 jan 2008 ano
21.299
-0.294
-1.36%
1 jan 2009 ano
20.724
-0.575
-2.7%
1 jan 2010 ano
19.586
-1.137
-5.49%
1 jan 2011 ano
18.929
-0.658
-3.36%
1 jan 2012 ano
19.342
+0.413
2.18%
1 jan 2013 ano
19.71
+0.368
1.9%
1 jan 2014 ano
20.245
+0.535
2.71%
1 jan 2015 ano
18.942
-1.303
-6.44%
Classificação de países por estatísticas atuais por anos


Comentários: