29
/pt/
pt
AIzaSyAYiBZKx7MnpbEhh9jyipgxe19OcubqV5w
April 1, 2024
36578
IBRD only
IBD
false
2
1
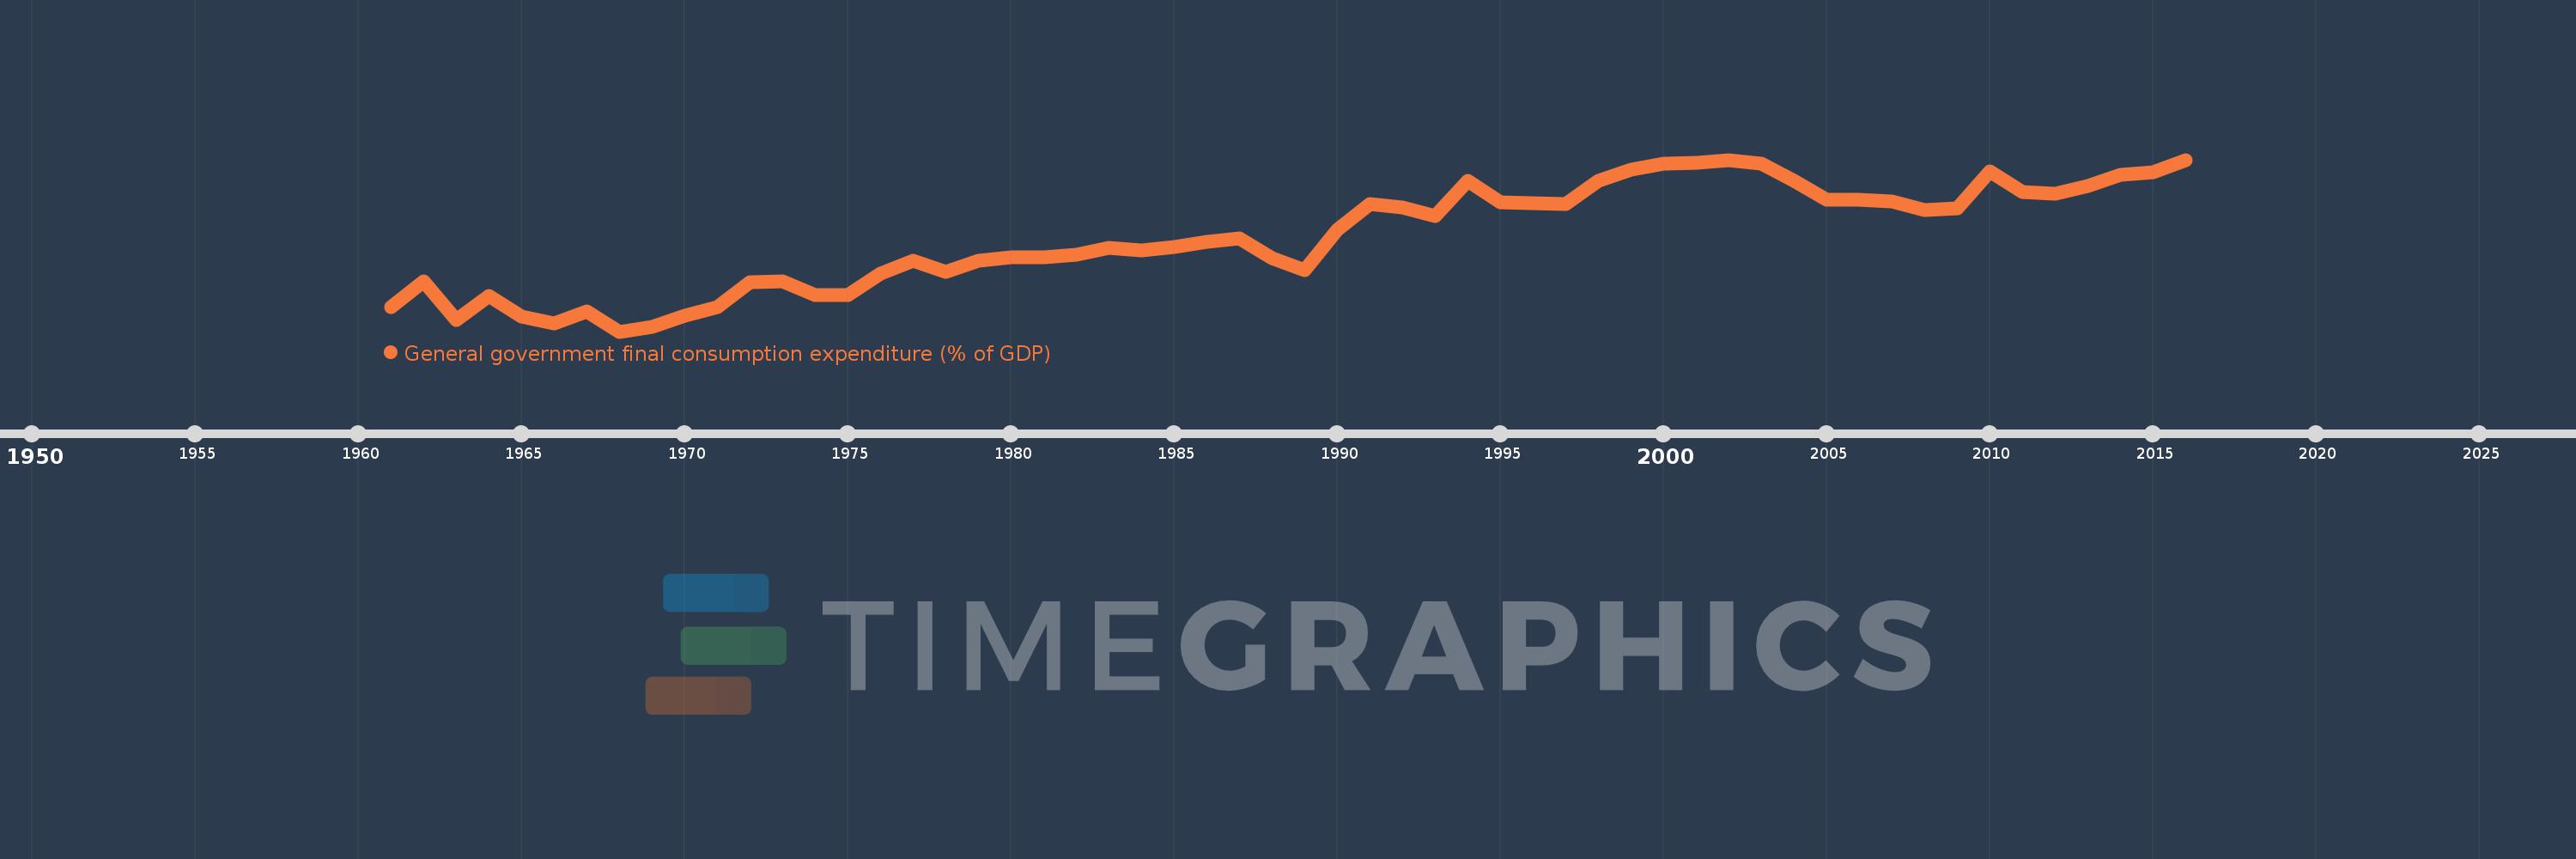
General government final consumption expenditure (% of GDP)
2016,2015,2014,2013,2012,2011,2010,2009,2008,2007,2006,2005,2004,2003,2002,2001,2000,1999,1998,1997,1996,1995,1994,1993,1992,1991,1990,1989,1988,1987,1986,1985,1984,1983,1982,1981,1980,1979,1978,1977,1976,1975,1974,1973,1972,1971,1970,1969,1968,1967,1966,1965,1964,1963,1962,1961
Estas estatísticas em outros países:
AfghanistanAlbaniaAlgeriaAngolaAntigua and BarbudaArab WorldArgentinaArmeniaArubaAustraliaAustriaAzerbaijanBahamas, TheBahrainBangladeshBarbadosBelarusBelgiumBelizeBeninBermudaBhutanBoliviaBosnia and HerzegovinaBotswanaBrazilBrunei DarussalamBulgariaBurkina FasoBurundiCabo VerdeCambodiaCameroonCanadaCaribbean small statesCentral African RepublicCentral Europe and the BalticsChadChileChinaColombiaComorosCongo, Dem. Rep.Congo, Rep.Costa RicaCote d'IvoireCroatiaCubaCyprusCzech RepublicDenmarkDjiboutiDominicaDominican RepublicEarly-demographic dividendEast Asia & PacificEast Asia & Pacific (excluding high income)East Asia & Pacific (IDA & IBRD countries)EcuadorEgypt, Arab Rep.El SalvadorEquatorial GuineaEritreaEstoniaEthiopiaEuro areaEurope & Central AsiaEurope & Central Asia (excluding high income)Europe & Central Asia (IDA & IBRD countries)European UnionFaroe IslandsFijiFinlandFragile and conflict affected situationsFranceFrench PolynesiaGabonGambia, TheGeorgiaGermanyGhanaGreeceGrenadaGuatemalaGuineaGuinea-BissauGuyanaHaitiHeavily indebted poor countries (HIPC)High incomeHondurasHong Kong SAR, ChinaHungaryIBRD onlyIcelandIDA & IBRD totalIDA blendIDA onlyIDA totalIndiaIndonesiaIran, Islamic Rep.IraqIrelandIsraelItalyJamaicaJapanJordanKazakhstanKenyaKiribatiKorea, Rep.KosovoKuwaitKyrgyz RepublicLao PDRLate-demographic dividendLatin America & Caribbean Latin America & Caribbean (excluding high income)Latin America & the Caribbean (IDA & IBRD countries)LatviaLeast developed countries: UN classificationLebanonLesothoLiberiaLibyaLithuaniaLow & middle incomeLow incomeLower middle incomeLuxembourgMacao SAR, ChinaMacedonia, FYRMadagascarMalawiMalaysiaMaldivesMaliMaltaMauritaniaMauritiusMexicoMicronesia, Fed. Sts.Middle East & North AfricaMiddle East & North Africa (excluding high income)Middle East & North Africa (IDA & IBRD countries)Middle incomeMoldovaMongoliaMontenegroMoroccoMozambiqueNamibiaNepalNetherlandsNew CaledoniaNew ZealandNicaraguaNigerNigeriaNorth AmericaNorwayOECD membersOmanOther small statesPacific island small statesPakistanPanamaPapua New GuineaParaguayPeruPhilippinesPolandPortugalPost-demographic dividendPre-demographic dividendPuerto RicoQatarRomaniaRussian FederationRwandaSaudi ArabiaSenegalSerbiaSeychellesSierra LeoneSingaporeSlovak RepublicSloveniaSmall statesSolomon IslandsSomaliaSouth AfricaSouth AsiaSouth Asia (IDA & IBRD)South SudanSpainSri LankaSt. Kitts and NevisSt. LuciaSt. Vincent and the GrenadinesSub-Saharan Africa Sub-Saharan Africa (excluding high income)Sub-Saharan Africa (IDA & IBRD countries)SudanSurinameSwazilandSwedenSwitzerlandSyrian Arab RepublicTajikistanTanzaniaThailandTimor-LesteTogoTongaTrinidad and TobagoTunisiaTurkeyTurkmenistanUgandaUkraineUnited Arab EmiratesUnited KingdomUnited StatesUpper middle incomeUruguayUzbekistanVanuatuVenezuela, RBVietnamWest Bank and GazaWorldYemen, Rep.ZambiaZimbabwe Linha do tempo:
Nesta escala de tempo está apresentado um gráfico de 1961 ano até 2016 ano IBRD only. Dados de 1960 ano ausente. O número de observações reais por data: 56.
Fonte (nome):
Indicadores de desenvolvimento mundial
Fonte (organização):
World Bank national accounts data, and OECD National Accounts data files.
Categorias:
Economy & Growth
Foi atualizado:
23 abr 2017 ano
Indicadores de alterações dos valores ao longo dos anos
Mínimo:
10.52
1 jan 1968 ano
Máximo:
15.118
1 jan 2016 ano
Na data de observação
Valor
Mudança absoluta
A alteração em relação ao valor anterior
1 jan 1961 ano
11.179
+11.179
0.0%
1 jan 1962 ano
11.859
+0.68
6.08%
1 jan 1963 ano
10.839
-1.02
-8.6%
1 jan 1964 ano
11.485
+0.646
5.96%
1 jan 1965 ano
10.929
-0.556
-4.84%
1 jan 1966 ano
10.73
-0.199
-1.82%
1 jan 1967 ano
11.061
+0.331
3.08%
1 jan 1968 ano
10.52
-0.542
-4.9%
1 jan 1969 ano
10.652
+0.132
1.25%
1 jan 1970 ano
10.943
+0.292
2.74%
1 jan 1971 ano
11.184
+0.24
2.2%
1 jan 1972 ano
11.853
+0.669
5.98%
1 jan 1973 ano
11.872
+0.019
0.16%
1 jan 1974 ano
11.489
-0.383
-3.23%
1 jan 1975 ano
11.486
-0.003
-0.02%
1 jan 1976 ano
12.083
+0.597
5.19%
1 jan 1977 ano
12.428
+0.345
2.85%
1 jan 1978 ano
12.115
-0.312
-2.51%
1 jan 1979 ano
12.426
+0.31
2.56%
1 jan 1980 ano
12.509
+0.083
0.67%
1 jan 1981 ano
12.52
+0.011
0.09%
1 jan 1982 ano
12.578
+0.058
0.46%
1 jan 1983 ano
12.756
+0.178
1.42%
1 jan 1984 ano
12.695
-0.061
-0.48%
1 jan 1985 ano
12.786
+0.091
0.72%
1 jan 1986 ano
12.922
+0.136
1.06%
1 jan 1987 ano
13.009
+0.087
0.67%
1 jan 1988 ano
12.485
-0.524
-4.02%
1 jan 1989 ano
12.153
-0.332
-2.66%
1 jan 1990 ano
13.244
+1.091
8.98%
1 jan 1991 ano
13.945
+0.701
5.29%
1 jan 1992 ano
13.853
-0.092
-0.66%
1 jan 1993 ano
13.603
-0.25
-1.8%
1 jan 1994 ano
14.559
+0.956
7.03%
1 jan 1995 ano
13.987
-0.572
-3.93%
1 jan 1996 ano
13.953
-0.034
-0.24%
1 jan 1997 ano
13.932
-0.021
-0.15%
1 jan 1998 ano
14.55
+0.618
4.43%
1 jan 1999 ano
14.848
+0.298
2.05%
1 jan 2000 ano
15.025
+0.176
1.19%
1 jan 2001 ano
15.031
+0.007
0.05%
1 jan 2002 ano
15.103
+0.072
0.48%
1 jan 2003 ano
15.025
-0.078
-0.51%
1 jan 2004 ano
14.555
-0.471
-3.13%
1 jan 2005 ano
14.053
-0.501
-3.45%
1 jan 2006 ano
14.058
+0.004
0.03%
1 jan 2007 ano
13.996
-0.062
-0.44%
1 jan 2008 ano
13.771
-0.225
-1.61%
1 jan 2009 ano
13.811
+0.04
0.29%
1 jan 2010 ano
14.814
+1.003
7.26%
1 jan 2011 ano
14.259
-0.555
-3.75%
1 jan 2012 ano
14.199
-0.06
-0.42%
1 jan 2013 ano
14.428
+0.229
1.61%
1 jan 2014 ano
14.725
+0.297
2.06%
1 jan 2015 ano
14.796
+0.071
0.48%
1 jan 2016 ano
15.118
+0.322
2.17%
Classificação de países por estatísticas atuais por anos


Comentários: