29
/pt/
pt
AIzaSyAYiBZKx7MnpbEhh9jyipgxe19OcubqV5w
April 1, 2024
211718
Niger
NER
true
2
1
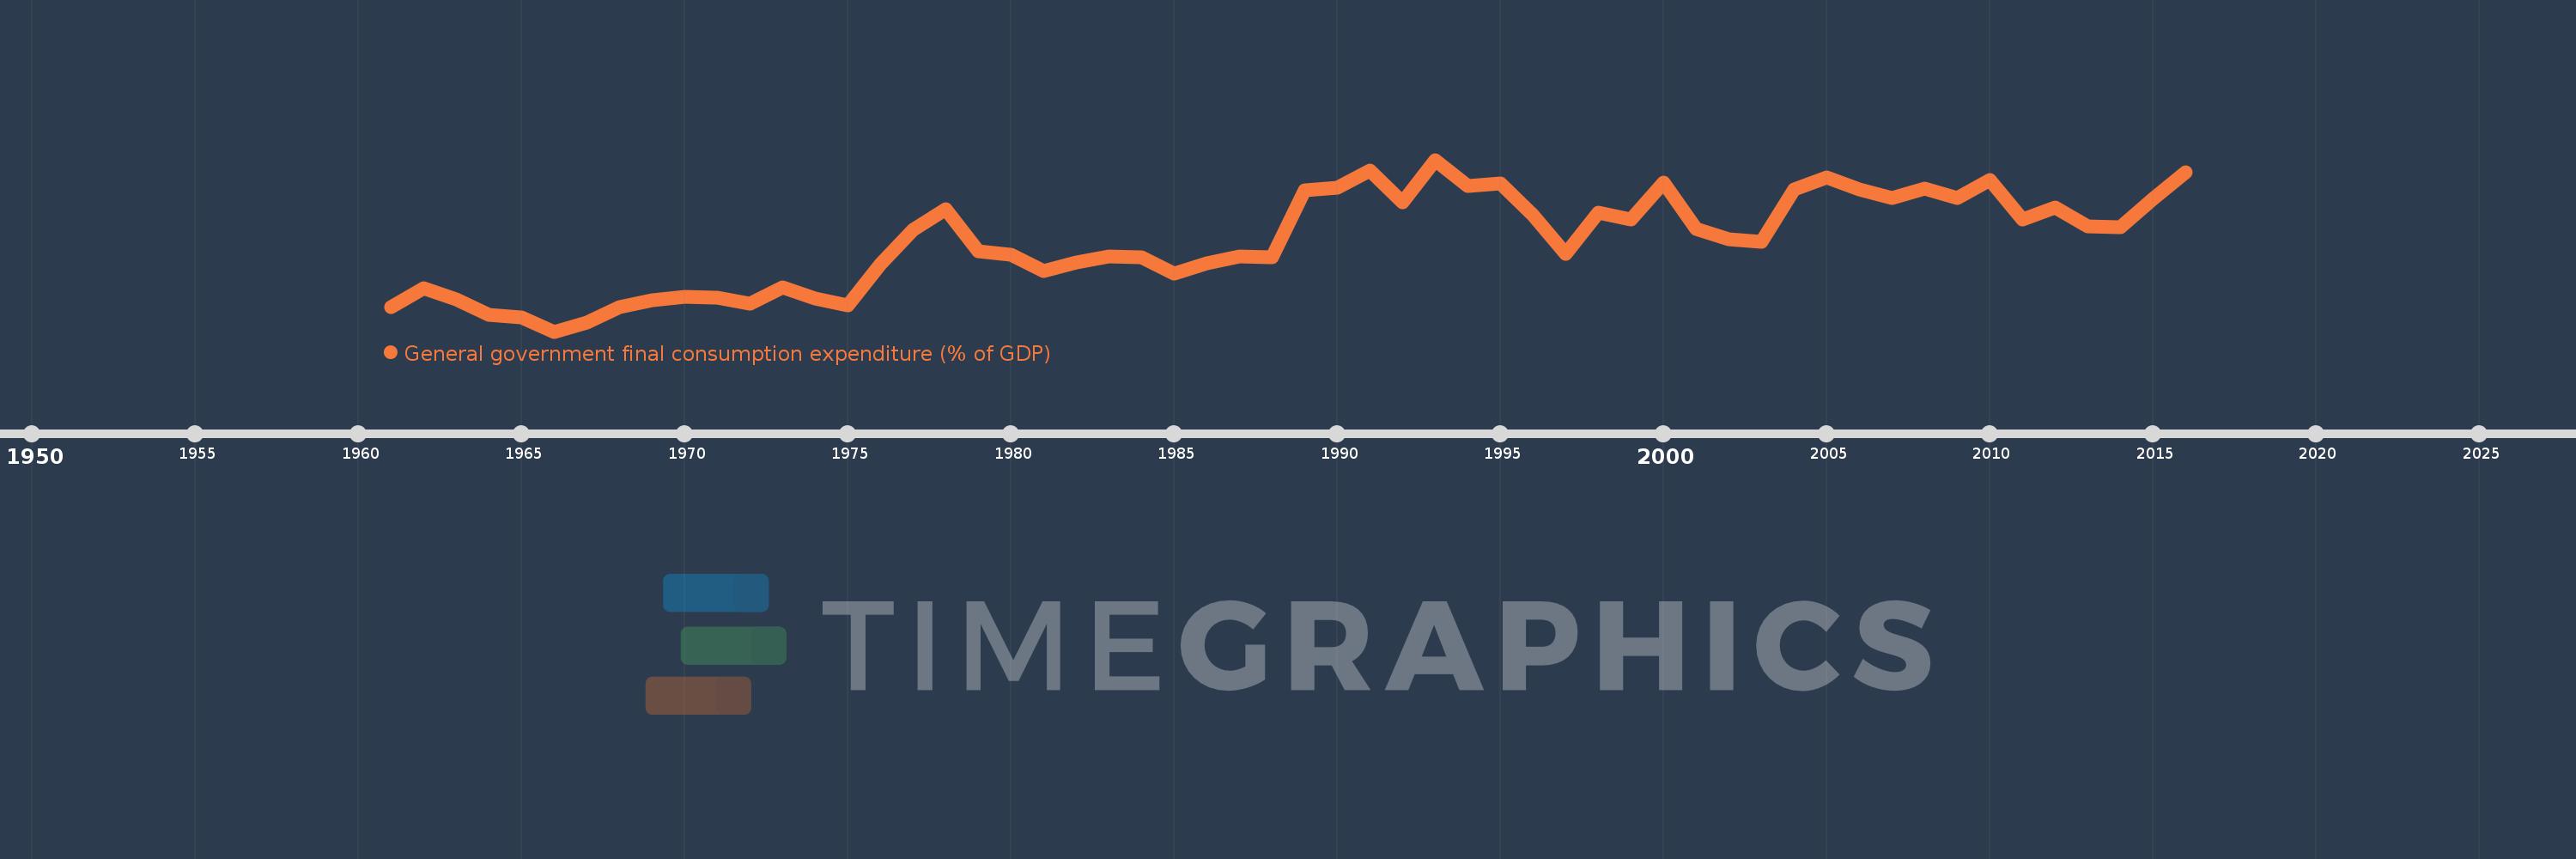
General government final consumption expenditure (% of GDP)
2016,2015,2014,2013,2012,2011,2010,2009,2008,2007,2006,2005,2004,2003,2002,2001,2000,1999,1998,1997,1996,1995,1994,1993,1992,1991,1990,1989,1988,1987,1986,1985,1984,1983,1982,1981,1980,1979,1978,1977,1976,1975,1974,1973,1972,1971,1970,1969,1968,1967,1966,1965,1964,1963,1962,1961
Estas estatísticas em outros países:
AfghanistanAlbaniaAlgeriaAngolaAntigua and BarbudaArab WorldArgentinaArmeniaArubaAustraliaAustriaAzerbaijanBahamas, TheBahrainBangladeshBarbadosBelarusBelgiumBelizeBeninBermudaBhutanBoliviaBosnia and HerzegovinaBotswanaBrazilBrunei DarussalamBulgariaBurkina FasoBurundiCabo VerdeCambodiaCameroonCanadaCaribbean small statesCentral African RepublicCentral Europe and the BalticsChadChileChinaColombiaComorosCongo, Dem. Rep.Congo, Rep.Costa RicaCote d'IvoireCroatiaCubaCyprusCzech RepublicDenmarkDjiboutiDominicaDominican RepublicEarly-demographic dividendEast Asia & PacificEast Asia & Pacific (excluding high income)East Asia & Pacific (IDA & IBRD countries)EcuadorEgypt, Arab Rep.El SalvadorEquatorial GuineaEritreaEstoniaEthiopiaEuro areaEurope & Central AsiaEurope & Central Asia (excluding high income)Europe & Central Asia (IDA & IBRD countries)European UnionFaroe IslandsFijiFinlandFragile and conflict affected situationsFranceFrench PolynesiaGabonGambia, TheGeorgiaGermanyGhanaGreeceGrenadaGuatemalaGuineaGuinea-BissauGuyanaHaitiHeavily indebted poor countries (HIPC)High incomeHondurasHong Kong SAR, ChinaHungaryIBRD onlyIcelandIDA & IBRD totalIDA blendIDA onlyIDA totalIndiaIndonesiaIran, Islamic Rep.IraqIrelandIsraelItalyJamaicaJapanJordanKazakhstanKenyaKiribatiKorea, Rep.KosovoKuwaitKyrgyz RepublicLao PDRLate-demographic dividendLatin America & Caribbean Latin America & Caribbean (excluding high income)Latin America & the Caribbean (IDA & IBRD countries)LatviaLeast developed countries: UN classificationLebanonLesothoLiberiaLibyaLithuaniaLow & middle incomeLow incomeLower middle incomeLuxembourgMacao SAR, ChinaMacedonia, FYRMadagascarMalawiMalaysiaMaldivesMaliMaltaMauritaniaMauritiusMexicoMicronesia, Fed. Sts.Middle East & North AfricaMiddle East & North Africa (excluding high income)Middle East & North Africa (IDA & IBRD countries)Middle incomeMoldovaMongoliaMontenegroMoroccoMozambiqueNamibiaNepalNetherlandsNew CaledoniaNew ZealandNicaraguaNigerNigeriaNorth AmericaNorwayOECD membersOmanOther small statesPacific island small statesPakistanPanamaPapua New GuineaParaguayPeruPhilippinesPolandPortugalPost-demographic dividendPre-demographic dividendPuerto RicoQatarRomaniaRussian FederationRwandaSaudi ArabiaSenegalSerbiaSeychellesSierra LeoneSingaporeSlovak RepublicSloveniaSmall statesSolomon IslandsSomaliaSouth AfricaSouth AsiaSouth Asia (IDA & IBRD)South SudanSpainSri LankaSt. Kitts and NevisSt. LuciaSt. Vincent and the GrenadinesSub-Saharan Africa Sub-Saharan Africa (excluding high income)Sub-Saharan Africa (IDA & IBRD countries)SudanSurinameSwazilandSwedenSwitzerlandSyrian Arab RepublicTajikistanTanzaniaThailandTimor-LesteTogoTongaTrinidad and TobagoTunisiaTurkeyTurkmenistanUgandaUkraineUnited Arab EmiratesUnited KingdomUnited StatesUpper middle incomeUruguayUzbekistanVanuatuVenezuela, RBVietnamWest Bank and GazaWorldYemen, Rep.ZambiaZimbabwe Linha do tempo:
Nesta escala de tempo está apresentado um gráfico de 1961 ano até 2016 ano Niger. Dados de 1960 ano ausente. O número de observações reais por data: 56.
Fonte (nome):
Indicadores de desenvolvimento mundial
Fonte (organização):
World Bank national accounts data, and OECD National Accounts data files.
Categorias:
Economy & Growth
Foi atualizado:
23 abr 2017 ano
Indicadores de alterações dos valores ao longo dos anos
Mínimo:
6.483
1 jan 1966 ano
Máximo:
17.474
1 jan 1993 ano
Na data de observação
Valor
Mudança absoluta
A alteração em relação ao valor anterior
1 jan 1961 ano
8.043
+8.043
0.0%
1 jan 1962 ano
9.237
+1.194
14.84%
1 jan 1963 ano
8.565
-0.672
-7.28%
1 jan 1964 ano
7.555
-1.01
-11.79%
1 jan 1965 ano
7.385
-0.169
-2.24%
1 jan 1966 ano
6.483
-0.902
-12.21%
1 jan 1967 ano
7.087
+0.603
9.31%
1 jan 1968 ano
8.028
+0.941
13.28%
1 jan 1969 ano
8.473
+0.445
5.54%
1 jan 1970 ano
8.736
+0.264
3.11%
1 jan 1971 ano
8.678
-0.058
-0.66%
1 jan 1972 ano
8.243
-0.435
-5.02%
1 jan 1973 ano
9.308
+1.065
12.91%
1 jan 1974 ano
8.622
-0.685
-7.36%
1 jan 1975 ano
8.168
-0.454
-5.27%
1 jan 1976 ano
10.813
+2.645
32.38%
1 jan 1977 ano
12.979
+2.166
20.03%
1 jan 1978 ano
14.307
+1.328
10.23%
1 jan 1979 ano
11.604
-2.702
-18.89%
1 jan 1980 ano
11.411
-0.193
-1.66%
1 jan 1981 ano
10.377
-1.034
-9.06%
1 jan 1982 ano
10.934
+0.557
5.36%
1 jan 1983 ano
11.312
+0.378
3.46%
1 jan 1984 ano
11.236
-0.077
-0.68%
1 jan 1985 ano
10.211
-1.024
-9.12%
1 jan 1986 ano
10.831
+0.62
6.07%
1 jan 1987 ano
11.298
+0.467
4.31%
1 jan 1988 ano
11.22
-0.078
-0.69%
1 jan 1989 ano
15.504
+4.283
38.17%
1 jan 1990 ano
15.705
+0.202
1.3%
1 jan 1991 ano
16.789
+1.083
6.9%
1 jan 1992 ano
14.781
-2.008
-11.96%
1 jan 1993 ano
17.474
+2.693
18.22%
1 jan 1994 ano
15.789
-1.685
-9.64%
1 jan 1995 ano
15.964
+0.175
1.11%
1 jan 1996 ano
13.936
-2.028
-12.7%
1 jan 1997 ano
11.45
-2.486
-17.84%
1 jan 1998 ano
14.077
+2.627
22.94%
1 jan 1999 ano
13.659
-0.418
-2.97%
1 jan 2000 ano
16.037
+2.378
17.41%
1 jan 2001 ano
13.039
-2.998
-18.69%
1 jan 2002 ano
12.384
-0.655
-5.02%
1 jan 2003 ano
12.235
-0.149
-1.2%
1 jan 2004 ano
15.581
+3.346
27.35%
1 jan 2005 ano
16.326
+0.744
4.78%
1 jan 2006 ano
15.598
-0.728
-4.46%
1 jan 2007 ano
15.008
-0.589
-3.78%
1 jan 2008 ano
15.65
+0.641
4.27%
1 jan 2009 ano
15.005
-0.644
-4.12%
1 jan 2010 ano
16.205
+1.2
7.99%
1 jan 2011 ano
13.644
-2.561
-15.8%
1 jan 2012 ano
14.433
+0.789
5.78%
1 jan 2013 ano
13.218
-1.214
-8.41%
1 jan 2014 ano
13.144
-0.074
-0.56%
1 jan 2015 ano
14.97
+1.826
13.89%
1 jan 2016 ano
16.678
+1.708
11.41%
Classificação de países por estatísticas atuais por anos


Comentários: