29
/pt/
pt
AIzaSyAYiBZKx7MnpbEhh9jyipgxe19OcubqV5w
April 1, 2024
222193
Peru
PER
true
2
1
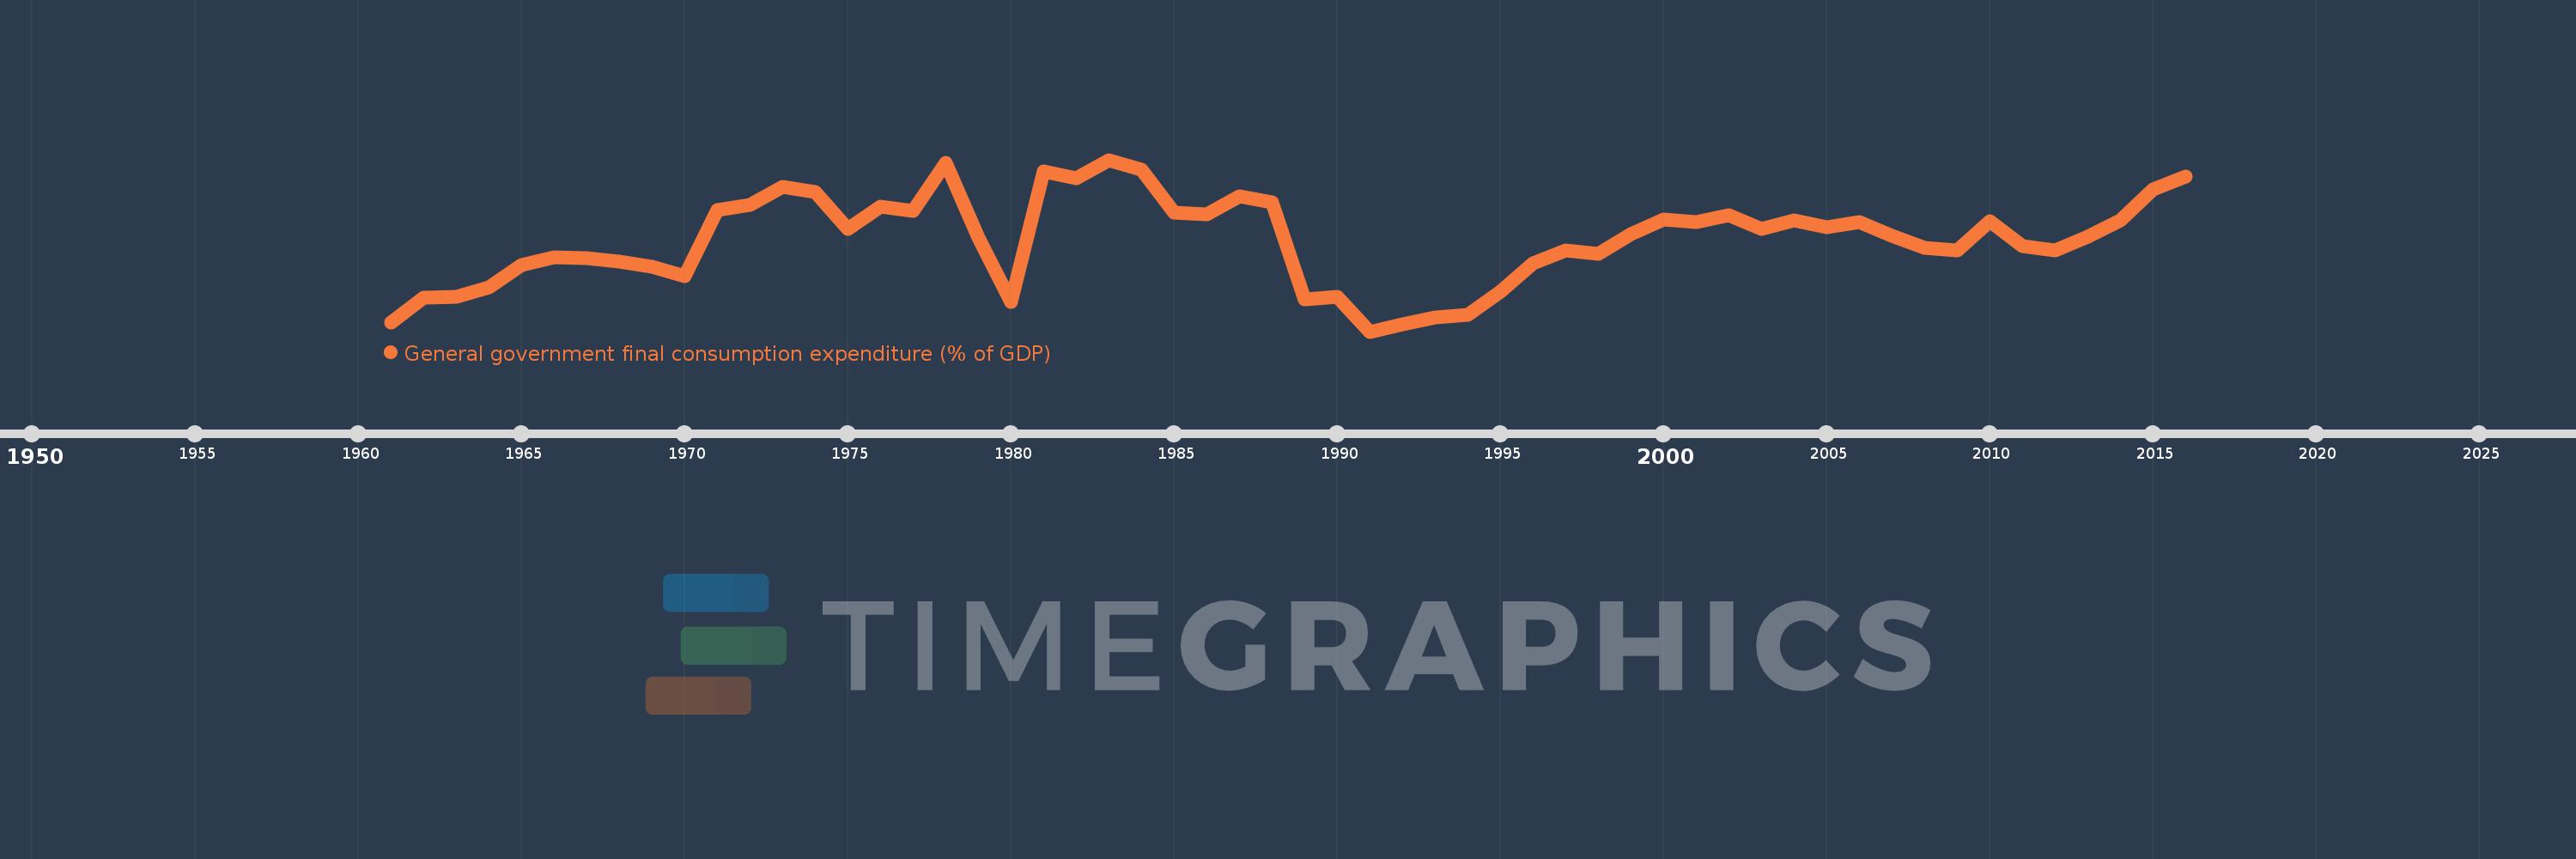
General government final consumption expenditure (% of GDP)
2016,2015,2014,2013,2012,2011,2010,2009,2008,2007,2006,2005,2004,2003,2002,2001,2000,1999,1998,1997,1996,1995,1994,1993,1992,1991,1990,1989,1988,1987,1986,1985,1984,1983,1982,1981,1980,1979,1978,1977,1976,1975,1974,1973,1972,1971,1970,1969,1968,1967,1966,1965,1964,1963,1962,1961
Estas estatísticas em outros países:
AfghanistanAlbaniaAlgeriaAngolaAntigua and BarbudaArab WorldArgentinaArmeniaArubaAustraliaAustriaAzerbaijanBahamas, TheBahrainBangladeshBarbadosBelarusBelgiumBelizeBeninBermudaBhutanBoliviaBosnia and HerzegovinaBotswanaBrazilBrunei DarussalamBulgariaBurkina FasoBurundiCabo VerdeCambodiaCameroonCanadaCaribbean small statesCentral African RepublicCentral Europe and the BalticsChadChileChinaColombiaComorosCongo, Dem. Rep.Congo, Rep.Costa RicaCote d'IvoireCroatiaCubaCyprusCzech RepublicDenmarkDjiboutiDominicaDominican RepublicEarly-demographic dividendEast Asia & PacificEast Asia & Pacific (excluding high income)East Asia & Pacific (IDA & IBRD countries)EcuadorEgypt, Arab Rep.El SalvadorEquatorial GuineaEritreaEstoniaEthiopiaEuro areaEurope & Central AsiaEurope & Central Asia (excluding high income)Europe & Central Asia (IDA & IBRD countries)European UnionFaroe IslandsFijiFinlandFragile and conflict affected situationsFranceFrench PolynesiaGabonGambia, TheGeorgiaGermanyGhanaGreeceGrenadaGuatemalaGuineaGuinea-BissauGuyanaHaitiHeavily indebted poor countries (HIPC)High incomeHondurasHong Kong SAR, ChinaHungaryIBRD onlyIcelandIDA & IBRD totalIDA blendIDA onlyIDA totalIndiaIndonesiaIran, Islamic Rep.IraqIrelandIsraelItalyJamaicaJapanJordanKazakhstanKenyaKiribatiKorea, Rep.KosovoKuwaitKyrgyz RepublicLao PDRLate-demographic dividendLatin America & Caribbean Latin America & Caribbean (excluding high income)Latin America & the Caribbean (IDA & IBRD countries)LatviaLeast developed countries: UN classificationLebanonLesothoLiberiaLibyaLithuaniaLow & middle incomeLow incomeLower middle incomeLuxembourgMacao SAR, ChinaMacedonia, FYRMadagascarMalawiMalaysiaMaldivesMaliMaltaMauritaniaMauritiusMexicoMicronesia, Fed. Sts.Middle East & North AfricaMiddle East & North Africa (excluding high income)Middle East & North Africa (IDA & IBRD countries)Middle incomeMoldovaMongoliaMontenegroMoroccoMozambiqueNamibiaNepalNetherlandsNew CaledoniaNew ZealandNicaraguaNigerNigeriaNorth AmericaNorwayOECD membersOmanOther small statesPacific island small statesPakistanPanamaPapua New GuineaParaguayPeruPhilippinesPolandPortugalPost-demographic dividendPre-demographic dividendPuerto RicoQatarRomaniaRussian FederationRwandaSaudi ArabiaSenegalSerbiaSeychellesSierra LeoneSingaporeSlovak RepublicSloveniaSmall statesSolomon IslandsSomaliaSouth AfricaSouth AsiaSouth Asia (IDA & IBRD)South SudanSpainSri LankaSt. Kitts and NevisSt. LuciaSt. Vincent and the GrenadinesSub-Saharan Africa Sub-Saharan Africa (excluding high income)Sub-Saharan Africa (IDA & IBRD countries)SudanSurinameSwazilandSwedenSwitzerlandSyrian Arab RepublicTajikistanTanzaniaThailandTimor-LesteTogoTongaTrinidad and TobagoTunisiaTurkeyTurkmenistanUgandaUkraineUnited Arab EmiratesUnited KingdomUnited StatesUpper middle incomeUruguayUzbekistanVanuatuVenezuela, RBVietnamWest Bank and GazaWorldYemen, Rep.ZambiaZimbabwe Linha do tempo:
Nesta escala de tempo está apresentado um gráfico de 1961 ano até 2016 ano Peru. Dados de 1960 ano ausente. O número de observações reais por data: 56.
Fonte (nome):
Indicadores de desenvolvimento mundial
Fonte (organização):
World Bank national accounts data, and OECD National Accounts data files.
Categorias:
Economy & Growth
Foi atualizado:
23 abr 2017 ano
Indicadores de alterações dos valores ao longo dos anos
Mínimo:
7.274
1 jan 1991 ano
Máximo:
13.813
1 jan 1983 ano
Na data de observação
Valor
Mudança absoluta
A alteração em relação ao valor anterior
1 jan 1961 ano
7.623
+7.623
0.0%
1 jan 1962 ano
8.564
+0.94
12.33%
1 jan 1963 ano
8.613
+0.049
0.58%
1 jan 1964 ano
8.956
+0.343
3.98%
1 jan 1965 ano
9.802
+0.846
9.45%
1 jan 1966 ano
10.11
+0.308
3.14%
1 jan 1967 ano
10.071
-0.04
-0.39%
1 jan 1968 ano
9.927
-0.144
-1.43%
1 jan 1969 ano
9.73
-0.197
-1.98%
1 jan 1970 ano
9.377
-0.354
-3.63%
1 jan 1971 ano
11.89
+2.514
26.81%
1 jan 1972 ano
12.095
+0.204
1.72%
1 jan 1973 ano
12.794
+0.7
5.79%
1 jan 1974 ano
12.574
-0.22
-1.72%
1 jan 1975 ano
11.187
-1.387
-11.03%
1 jan 1976 ano
12.026
+0.839
7.5%
1 jan 1977 ano
11.863
-0.163
-1.36%
1 jan 1978 ano
13.704
+1.841
15.52%
1 jan 1979 ano
10.865
-2.839
-20.72%
1 jan 1980 ano
8.387
-2.477
-22.8%
1 jan 1981 ano
13.362
+4.974
59.31%
1 jan 1982 ano
13.126
-0.236
-1.77%
1 jan 1983 ano
13.813
+0.687
5.24%
1 jan 1984 ano
13.452
-0.361
-2.61%
1 jan 1985 ano
11.8
-1.652
-12.28%
1 jan 1986 ano
11.723
-0.077
-0.65%
1 jan 1987 ano
12.431
+0.708
6.04%
1 jan 1988 ano
12.205
-0.226
-1.82%
1 jan 1989 ano
8.508
-3.697
-30.29%
1 jan 1990 ano
8.584
+0.076
0.9%
1 jan 1991 ano
7.274
-1.311
-15.27%
1 jan 1992 ano
7.54
+0.266
3.65%
1 jan 1993 ano
7.822
+0.282
3.75%
1 jan 1994 ano
7.912
+0.09
1.15%
1 jan 1995 ano
8.797
+0.885
11.19%
1 jan 1996 ano
9.878
+1.081
12.29%
1 jan 1997 ano
10.359
+0.481
4.87%
1 jan 1998 ano
10.239
-0.121
-1.17%
1 jan 1999 ano
10.981
+0.743
7.25%
1 jan 2000 ano
11.549
+0.568
5.17%
1 jan 2001 ano
11.451
-0.098
-0.85%
1 jan 2002 ano
11.717
+0.267
2.33%
1 jan 2003 ano
11.165
-0.552
-4.71%
1 jan 2004 ano
11.519
+0.354
3.17%
1 jan 2005 ano
11.256
-0.262
-2.28%
1 jan 2006 ano
11.445
+0.188
1.67%
1 jan 2007 ano
10.917
-0.528
-4.61%
1 jan 2008 ano
10.455
-0.462
-4.23%
1 jan 2009 ano
10.371
-0.084
-0.81%
1 jan 2010 ano
11.466
+1.095
10.56%
1 jan 2011 ano
10.526
-0.941
-8.2%
1 jan 2012 ano
10.362
-0.163
-1.55%
1 jan 2013 ano
10.871
+0.509
4.91%
1 jan 2014 ano
11.499
+0.627
5.77%
1 jan 2015 ano
12.68
+1.181
10.28%
1 jan 2016 ano
13.182
+0.502
3.96%
Classificação de países por estatísticas atuais por anos


Comentários: