30
/pt/
AIzaSyAYiBZKx7MnpbEhh9jyipgxe19OcubqV5w
April 1, 2024
35881
High income
HIC
false
2
1
Labor force with primary education (% of total)
2015,2014,2013,2012,2011,2010,2008,2007,2003,2002,2001,2000,1999,1998
Download
Biblioteca de estatísticas globais →High income →

Labor force with primary education (% of total)

Estas estatísticas em outros países:

AlbaniaAlgeriaAntigua and BarbudaArgentinaArmeniaArubaAustraliaAustriaAzerbaijanBahamas, TheBahrainBarbadosBelarusBelgiumBelizeBermudaBoliviaBosnia and HerzegovinaBotswanaBrazilBritish Virgin IslandsBulgariaCambodiaCanadaCayman IslandsCentral Europe and the BalticsChadChileColombiaCosta RicaCroatiaCubaCyprusCzech RepublicDenmarkDominicaDominican RepublicEarly-demographic dividendEcuadorEgypt, Arab Rep.El SalvadorEstoniaEthiopiaEuro areaEurope & Central AsiaEurope & Central Asia (excluding high income)Europe & Central Asia (IDA & IBRD countries)European UnionFinlandFranceFrench PolynesiaGeorgiaGermanyGhanaGreeceGuatemalaGuyanaHigh incomeHondurasHong Kong SAR, ChinaHungaryIcelandIndiaIndonesiaIran, Islamic Rep.IrelandIsraelItalyJapanJordanKazakhstanKorea, Rep.KosovoKuwaitKyrgyz RepublicLatin America & Caribbean Latin America & Caribbean (excluding high income)Latin America & the Caribbean (IDA & IBRD countries)LatviaLebanonLithuaniaLuxembourgMacao SAR, ChinaMacedonia, FYRMadagascarMalaysiaMaltaMauritiusMexicoMoldovaMongoliaMontenegroMoroccoNamibiaNepalNetherlandsNew CaledoniaNew ZealandNicaraguaNigerNigeriaNorth AmericaNorwayOECD membersOmanPakistanPanamaParaguayPeruPhilippinesPolandPortugalPost-demographic dividendRomaniaRussian FederationRwandaSan MarinoSaudi ArabiaSerbiaSingaporeSlovak RepublicSloveniaSouth AfricaSouth AsiaSouth Asia (IDA & IBRD)SpainSri LankaSt. Kitts and NevisSt. LuciaSt. Vincent and the GrenadinesSwedenSwitzerlandSyrian Arab RepublicTajikistanThailandTimor-LesteTrinidad and TobagoTunisiaTurkeyUgandaUkraineUnited Arab EmiratesUnited KingdomUnited StatesUruguayVenezuela, RBWest Bank and GazaYemen, Rep.

Linha do tempo:

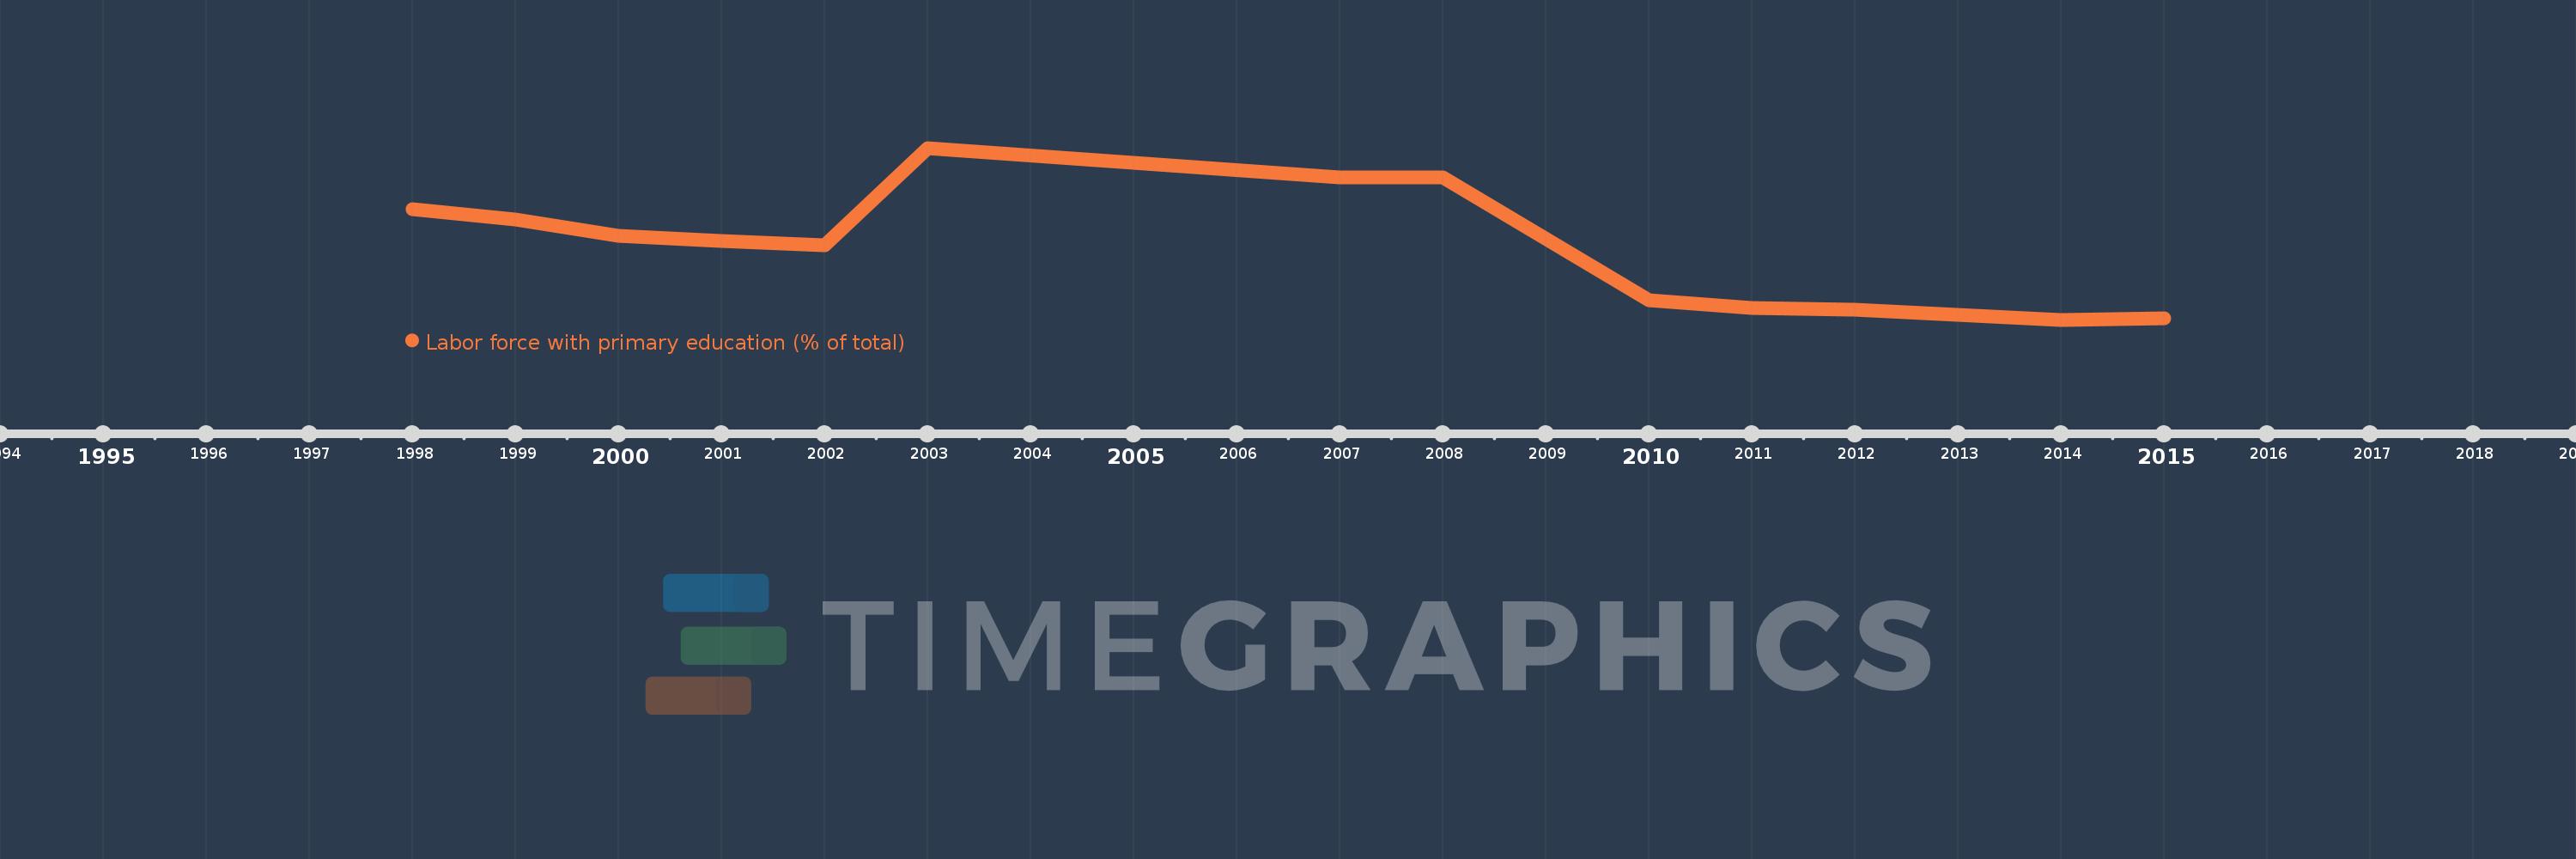
Nesta escala de tempo está apresentado um gráfico de 1998 ano até 2015 ano High income. Dados de 1997 ano ausente. O número de observações reais por data: 14.

Fonte (nome):

Indicadores de desenvolvimento mundial

Fonte (organização):

International Labour Organization, Key Indicators of the Labour Market database.

Categorias:

Education, Social Protection & Labor

Foi atualizado:

23 abr 2017 ano

Indicadores de alterações dos valores ao longo dos anos

Em média:
20.624
Mínimo:
12.453
1 jan 2014 ano
Máximo:
33.068
1 jan 2003 ano
Na data de observação
Valor
Mudança absoluta
A alteração em relação ao valor anterior
1 jan 1998 ano
25.714
+25.714
0.0%
1 jan 1999 ano
24.53
-1.184
-4.6%
1 jan 2000 ano
22.507
-2.023
-8.25%
1 jan 2001 ano
21.879
-0.629
-2.79%
1 jan 2002 ano
21.369
-0.51
-2.33%
1 jan 2003 ano
33.068
+11.699
54.75%
1 jan 2007 ano
29.575
-3.493
-10.56%
1 jan 2008 ano
29.567
-0.008
-0.03%
1 jan 2010 ano
14.77
-14.797
-50.05%
1 jan 2011 ano
13.906
-0.864
-5.85%
1 jan 2012 ano
13.654
-0.251
-1.81%
1 jan 2013 ano
13.071
-0.583
-4.27%
1 jan 2014 ano
12.453
-0.618
-4.73%
1 jan 2015 ano
12.67
+0.217
1.74%

Classificação de países por estatísticas atuais por anos