30
/pt/
AIzaSyAYiBZKx7MnpbEhh9jyipgxe19OcubqV5w
April 1, 2024
30002
Euro area
EMU
false
2
1
Labor force with primary education (% of total)
2015,2014,2013,2012,2011,2010,2009,2008,2007,2006,2005,2004,2003,2002,2001,2000,1999,1998,1997,1996,1995,1994,1993
Download
Biblioteca de estatísticas globais →Euro area →

Labor force with primary education (% of total)

Estas estatísticas em outros países:

AlbaniaAlgeriaAntigua and BarbudaArgentinaArmeniaArubaAustraliaAustriaAzerbaijanBahamas, TheBahrainBarbadosBelarusBelgiumBelizeBermudaBoliviaBosnia and HerzegovinaBotswanaBrazilBritish Virgin IslandsBulgariaCambodiaCanadaCayman IslandsCentral Europe and the BalticsChadChileColombiaCosta RicaCroatiaCubaCyprusCzech RepublicDenmarkDominicaDominican RepublicEarly-demographic dividendEcuadorEgypt, Arab Rep.El SalvadorEstoniaEthiopiaEuro areaEurope & Central AsiaEurope & Central Asia (excluding high income)Europe & Central Asia (IDA & IBRD countries)European UnionFinlandFranceFrench PolynesiaGeorgiaGermanyGhanaGreeceGuatemalaGuyanaHigh incomeHondurasHong Kong SAR, ChinaHungaryIcelandIndiaIndonesiaIran, Islamic Rep.IrelandIsraelItalyJapanJordanKazakhstanKorea, Rep.KosovoKuwaitKyrgyz RepublicLatin America & Caribbean Latin America & Caribbean (excluding high income)Latin America & the Caribbean (IDA & IBRD countries)LatviaLebanonLithuaniaLuxembourgMacao SAR, ChinaMacedonia, FYRMadagascarMalaysiaMaltaMauritiusMexicoMoldovaMongoliaMontenegroMoroccoNamibiaNepalNetherlandsNew CaledoniaNew ZealandNicaraguaNigerNigeriaNorth AmericaNorwayOECD membersOmanPakistanPanamaParaguayPeruPhilippinesPolandPortugalPost-demographic dividendRomaniaRussian FederationRwandaSan MarinoSaudi ArabiaSerbiaSingaporeSlovak RepublicSloveniaSouth AfricaSouth AsiaSouth Asia (IDA & IBRD)SpainSri LankaSt. Kitts and NevisSt. LuciaSt. Vincent and the GrenadinesSwedenSwitzerlandSyrian Arab RepublicTajikistanThailandTimor-LesteTrinidad and TobagoTunisiaTurkeyUgandaUkraineUnited Arab EmiratesUnited KingdomUnited StatesUruguayVenezuela, RBWest Bank and GazaYemen, Rep.

Linha do tempo:

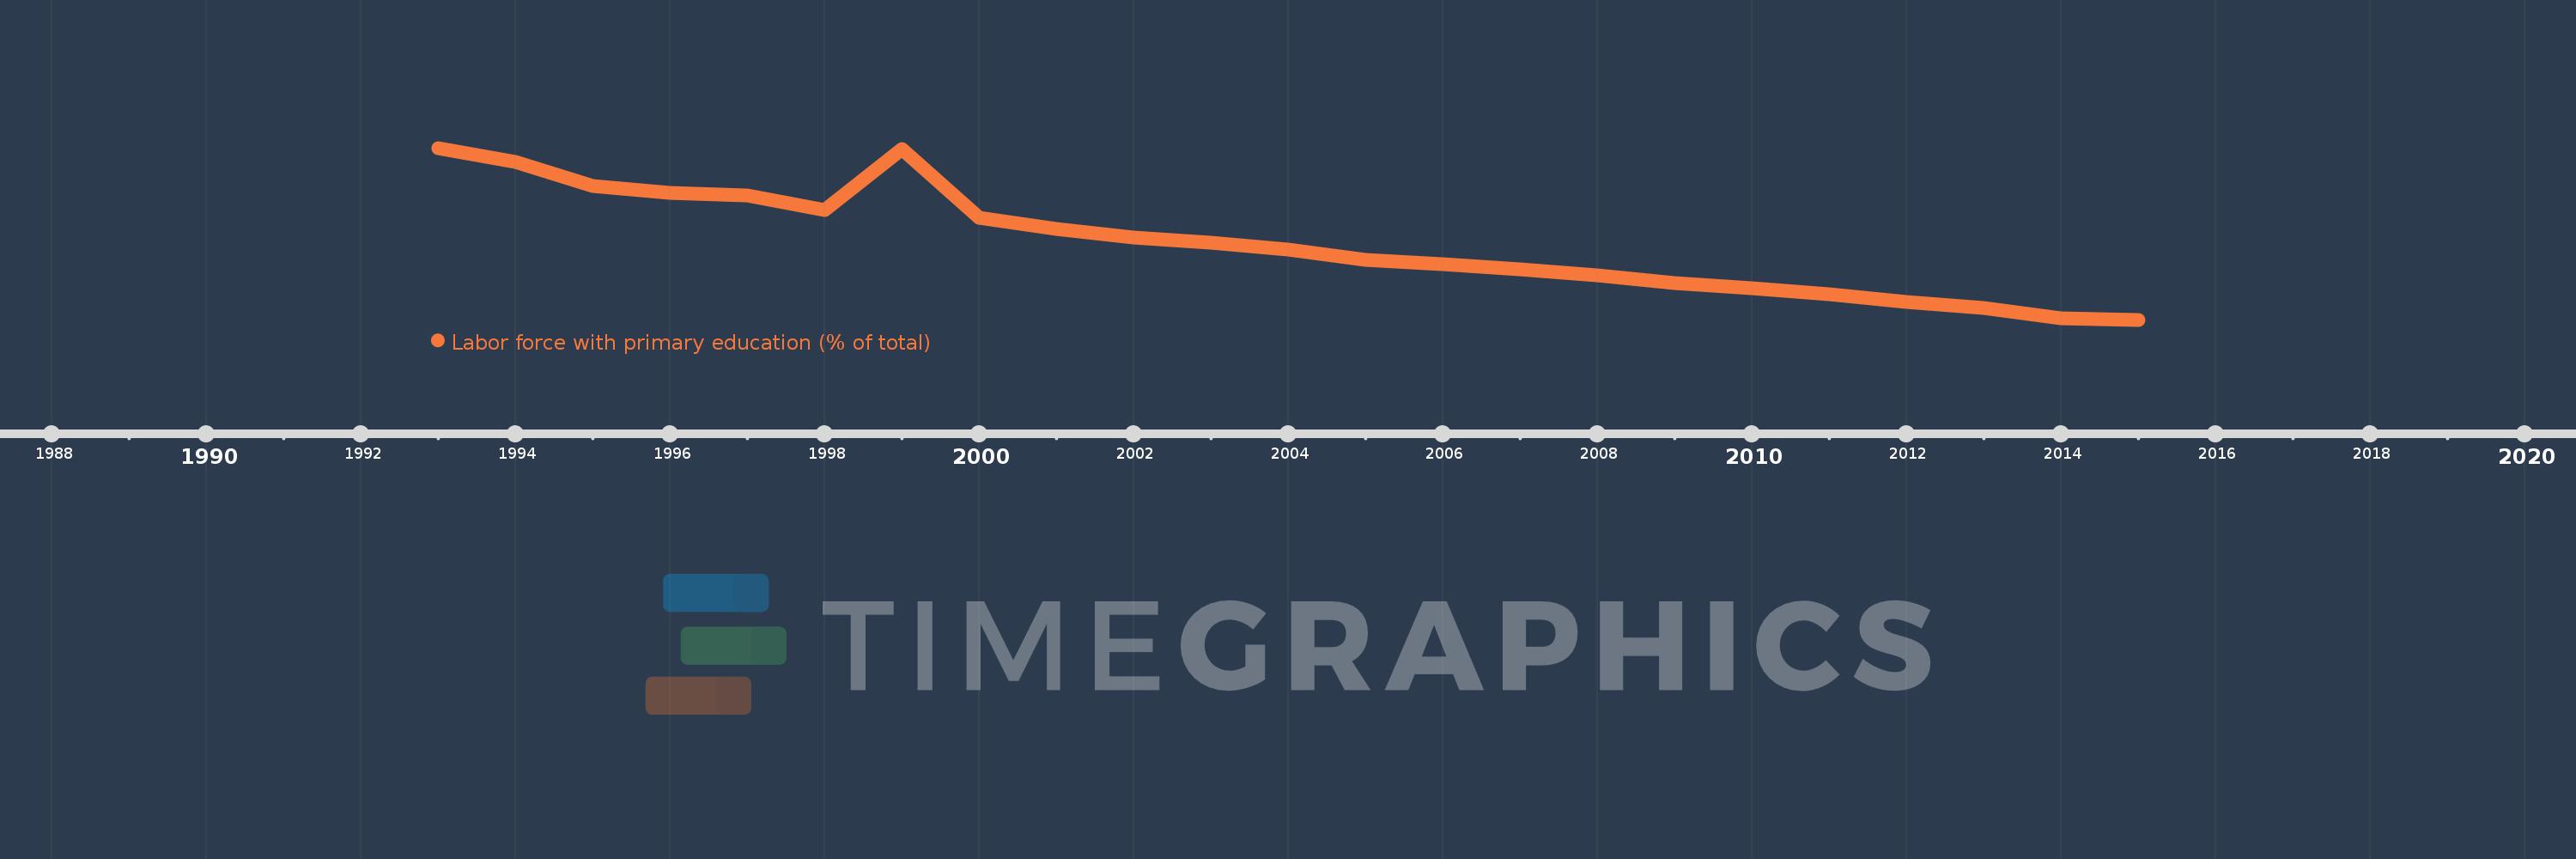
Nesta escala de tempo está apresentado um gráfico de 1993 ano até 2015 ano Euro area. Dados de 1992 ano ausente. O número de observações reais por data: 23.

Fonte (nome):

Indicadores de desenvolvimento mundial

Fonte (organização):

International Labour Organization, Key Indicators of the Labour Market database.

Categorias:

Education, Social Protection & Labor

Foi atualizado:

23 abr 2017 ano

Indicadores de alterações dos valores ao longo dos anos

Em média:
31.741
Mínimo:
23.399
1 jan 2015 ano
Máximo:
42.224
1 jan 1993 ano
Na data de observação
Valor
Mudança absoluta
A alteração em relação ao valor anterior
1 jan 1993 ano
42.224
+42.224
0.0%
1 jan 1994 ano
40.648
-1.576
-3.73%
1 jan 1995 ano
38.055
-2.593
-6.38%
1 jan 1996 ano
37.302
-0.753
-1.98%
1 jan 1997 ano
36.978
-0.324
-0.87%
1 jan 1998 ano
35.439
-1.538
-4.16%
1 jan 1999 ano
42.102
+6.663
18.8%
1 jan 2000 ano
34.54
-7.562
-17.96%
1 jan 2001 ano
33.348
-1.193
-3.45%
1 jan 2002 ano
32.369
-0.979
-2.94%
1 jan 2003 ano
31.836
-0.533
-1.65%
1 jan 2004 ano
31.073
-0.763
-2.4%
1 jan 2005 ano
29.985
-1.089
-3.5%
1 jan 2006 ano
29.443
-0.542
-1.81%
1 jan 2007 ano
28.96
-0.483
-1.64%
1 jan 2008 ano
28.22
-0.74
-2.56%
1 jan 2009 ano
27.437
-0.783
-2.77%
1 jan 2010 ano
26.825
-0.612
-2.23%
1 jan 2011 ano
26.209
-0.616
-2.3%
1 jan 2012 ano
25.316
-0.893
-3.41%
1 jan 2013 ano
24.728
-0.589
-2.33%
1 jan 2014 ano
23.605
-1.123
-4.54%
1 jan 2015 ano
23.399
-0.206
-0.87%

Classificação de países por estatísticas atuais por anos