29
/pt/
pt
AIzaSyAYiBZKx7MnpbEhh9jyipgxe19OcubqV5w
April 1, 2024
30825
Europe & Central Asia
ECS
false
2
1
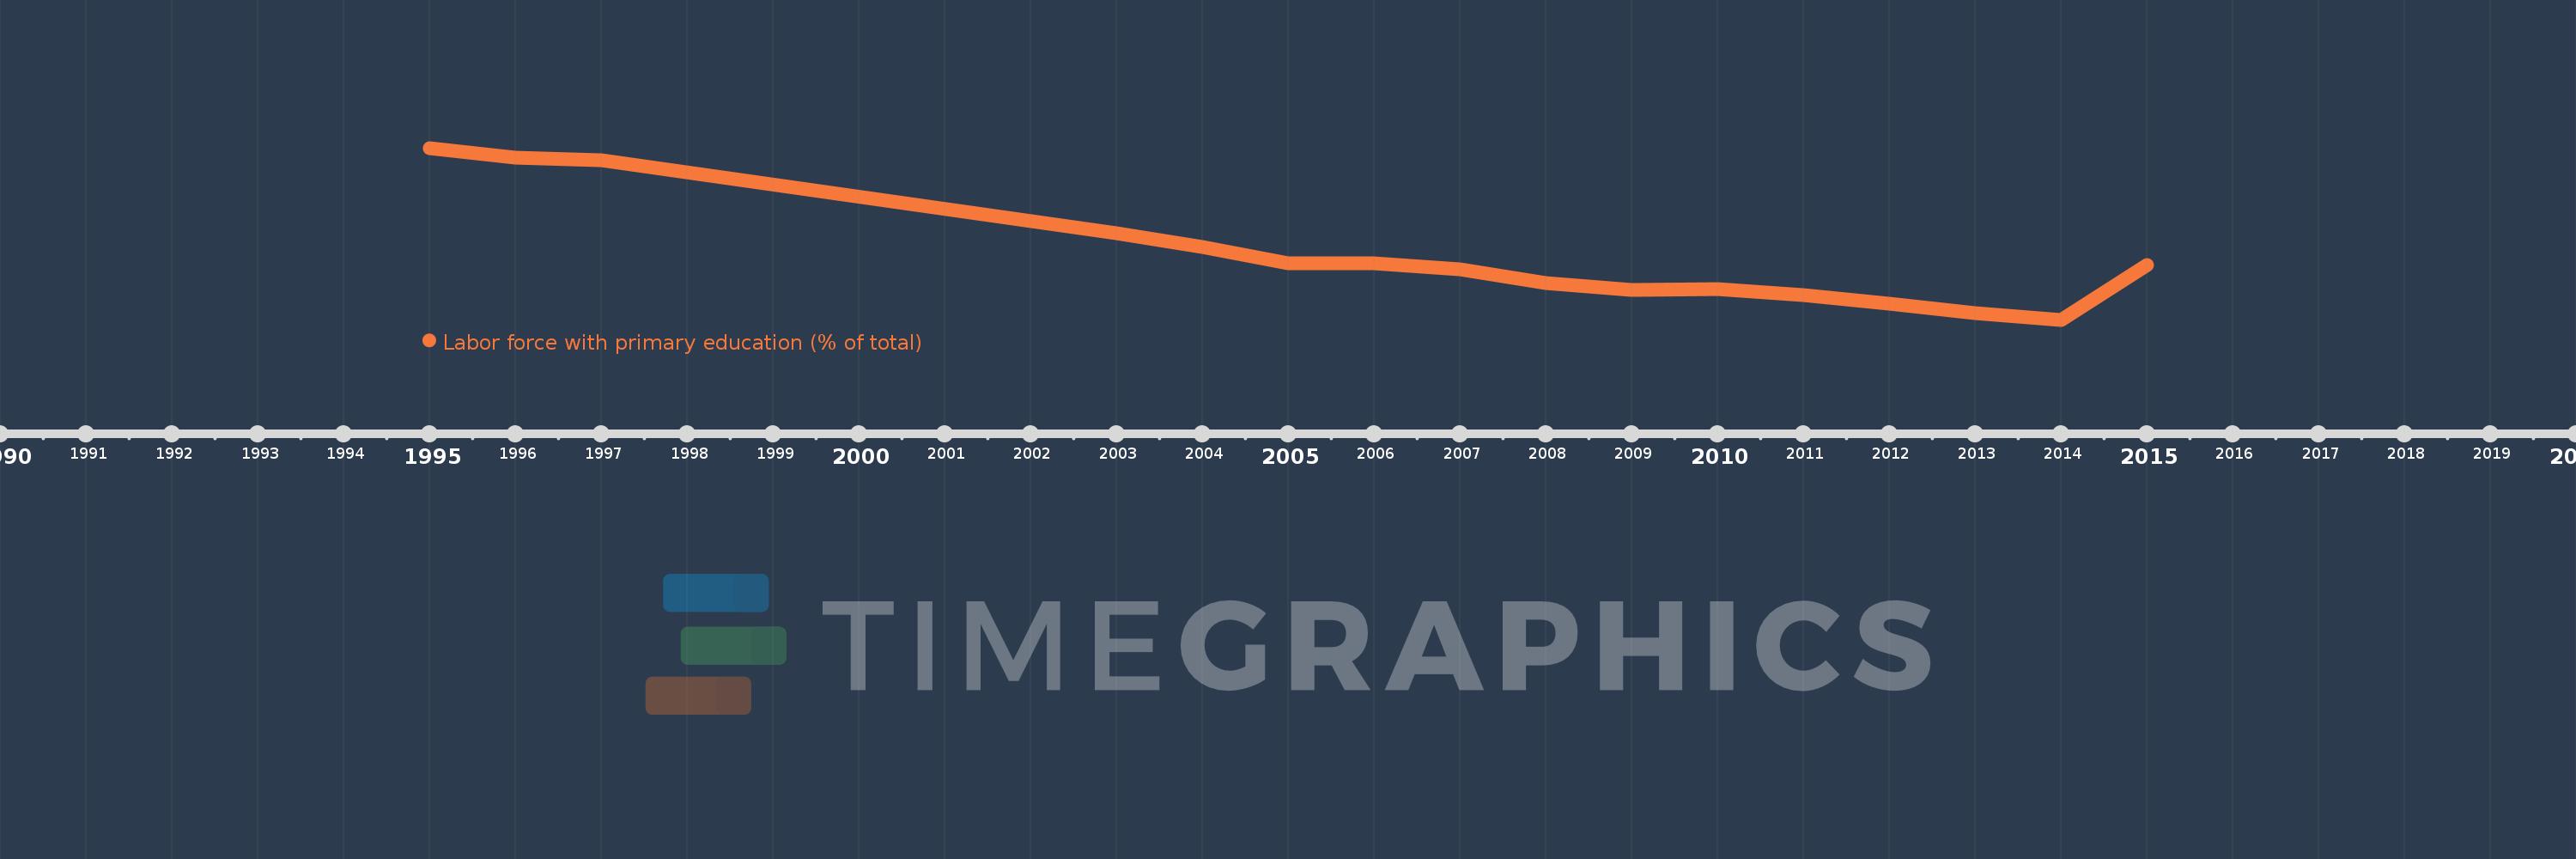
Labor force with primary education (% of total)
2015,2014,2013,2012,2011,2010,2009,2008,2007,2006,2005,2004,2003,1997,1996,1995
Estas estatísticas em outros países:
Linha do tempo:
Nesta escala de tempo está apresentado um gráfico de 1995 ano até 2015 ano Europe & Central Asia. Dados de 1994 ano ausente. O número de observações reais por data: 16.
Fonte (nome):
Indicadores de desenvolvimento mundial
Fonte (organização):
International Labour Organization, Key Indicators of the Labour Market database.
Categorias:
Education, Social Protection & Labor
Foi atualizado:
23 abr 2017 ano
Indicadores de alterações dos valores ao longo dos anos
Mínimo:
18.463
1 jan 2014 ano
Máximo:
30.665
1 jan 1995 ano
Na data de observação
Valor
Mudança absoluta
A alteração em relação ao valor anterior
1 jan 1995 ano
30.665
+30.665
0.0%
1 jan 1996 ano
29.996
-0.669
-2.18%
1 jan 1997 ano
29.791
-0.205
-0.68%
1 jan 2003 ano
24.634
-5.156
-17.31%
1 jan 2004 ano
23.622
-1.012
-4.11%
1 jan 2005 ano
22.479
-1.143
-4.84%
1 jan 2006 ano
22.49
+0.011
0.05%
1 jan 2007 ano
22.023
-0.467
-2.08%
1 jan 2008 ano
21.094
-0.928
-4.22%
1 jan 2009 ano
20.576
-0.519
-2.46%
1 jan 2010 ano
20.635
+0.059
0.29%
1 jan 2011 ano
20.198
-0.436
-2.12%
1 jan 2012 ano
19.574
-0.624
-3.09%
1 jan 2013 ano
18.962
-0.612
-3.13%
1 jan 2014 ano
18.463
-0.5
-2.63%
1 jan 2015 ano
22.361
+3.898
21.11%
Classificação de países por estatísticas atuais por anos


Comentários: