29
/pt/
pt
AIzaSyAYiBZKx7MnpbEhh9jyipgxe19OcubqV5w
April 1, 2024
282169
Vietnam
VNM
true
2
1
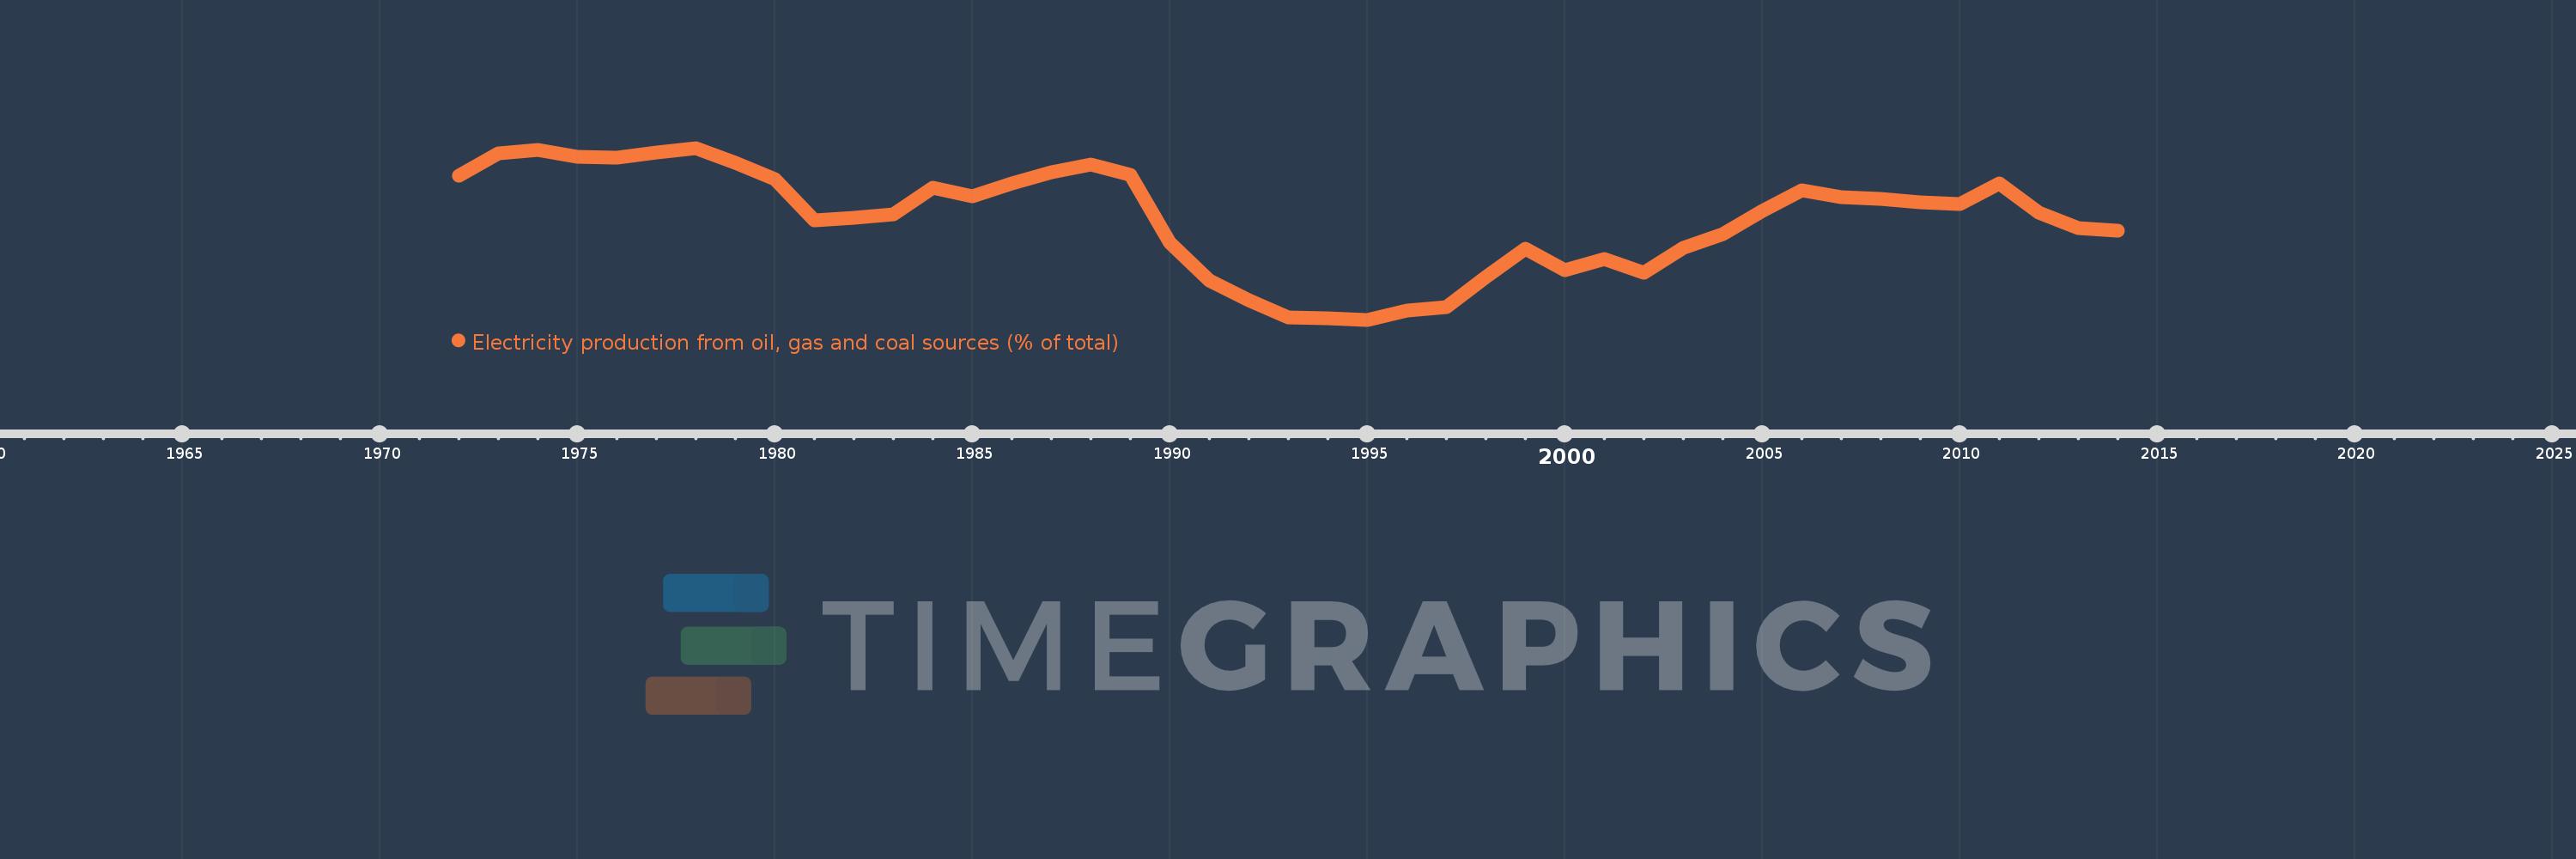
Electricity production from oil, gas and coal sources (% of total)
2014,2013,2012,2011,2010,2009,2008,2007,2006,2005,2004,2003,2002,2001,2000,1999,1998,1997,1996,1995,1994,1993,1992,1991,1990,1989,1988,1987,1986,1985,1984,1983,1982,1981,1980,1979,1978,1977,1976,1975,1974,1973,1972
Estas estatísticas em outros países:
AlbaniaAlgeriaAngolaArab WorldArgentinaArmeniaAustraliaAustriaAzerbaijanBahrainBangladeshBelarusBelgiumBeninBoliviaBosnia and HerzegovinaBotswanaBrazilBrunei DarussalamBulgariaCambodiaCameroonCanadaCentral Europe and the BalticsChileChinaColombiaCongo, Dem. Rep.Congo, Rep.Costa RicaCote d'IvoireCroatiaCubaCuracaoCyprusCzech RepublicDenmarkDominican RepublicEarly-demographic dividendEast Asia & PacificEast Asia & Pacific (excluding high income)East Asia & Pacific (IDA & IBRD countries)EcuadorEgypt, Arab Rep.El SalvadorEritreaEstoniaEthiopiaEuro areaEurope & Central AsiaEurope & Central Asia (excluding high income)Europe & Central Asia (IDA & IBRD countries)European UnionFinlandFragile and conflict affected situationsFranceGabonGeorgiaGermanyGhanaGibraltarGreeceGuatemalaHaitiHeavily indebted poor countries (HIPC)High incomeHondurasHong Kong SAR, ChinaHungaryIBRD onlyIcelandIDA & IBRD totalIDA blendIDA onlyIDA totalIndiaIndonesiaIran, Islamic Rep.IraqIrelandIsraelItalyJamaicaJapanJordanKazakhstanKenyaKorea, Dem. People’s Rep.Korea, Rep.KosovoKuwaitKyrgyz RepublicLate-demographic dividendLatin America & Caribbean Latin America & Caribbean (excluding high income)Latin America & the Caribbean (IDA & IBRD countries)LatviaLeast developed countries: UN classificationLebanonLibyaLithuaniaLow & middle incomeLower middle incomeLuxembourgMacedonia, FYRMalaysiaMaltaMauritiusMexicoMiddle East & North AfricaMiddle East & North Africa (excluding high income)Middle East & North Africa (IDA & IBRD countries)Middle incomeMoldovaMongoliaMontenegroMoroccoMozambiqueMyanmarNamibiaNepalNetherlandsNew ZealandNicaraguaNigerNigeriaNorth AmericaNorwayOECD membersOmanOther small statesPakistanPanamaParaguayPeruPhilippinesPolandPortugalPost-demographic dividendPre-demographic dividendQatarRomaniaRussian FederationSaudi ArabiaSenegalSerbiaSingaporeSlovak RepublicSloveniaSmall statesSouth AfricaSouth AsiaSouth Asia (IDA & IBRD)South SudanSpainSri LankaSub-Saharan Africa Sub-Saharan Africa (excluding high income)Sub-Saharan Africa (IDA & IBRD countries)SudanSwedenSwitzerlandSyrian Arab RepublicTajikistanTanzaniaThailandTogoTrinidad and TobagoTunisiaTurkeyTurkmenistanUkraineUnited Arab EmiratesUnited KingdomUnited StatesUpper middle incomeUruguayUzbekistanVenezuela, RBVietnamWorldYemen, Rep.ZambiaZimbabwe Linha do tempo:
Nesta escala de tempo está apresentado um gráfico de 1972 ano até 2014 ano Vietnam. Dados de 1971 ano ausente. O número de observações reais por data: 43.
Fonte (nome):
Indicadores de desenvolvimento mundial
Fonte (organização):
IEA Statistics © OECD/IEA 2014 (http://www.iea.org/stats/index.asp), subject to https://www.iea.org/t&c/termsandconditions/
Categorias:
Energy & Mining, Environment
Foi atualizado:
23 abr 2017 ano
Indicadores de alterações dos valores ao longo dos anos
Mínimo:
24.78
1 jan 1995 ano
Máximo:
82.724
1 jan 1978 ano
Na data de observação
Valor
Mudança absoluta
A alteração em relação ao valor anterior
1 jan 1972 ano
73.304
+73.304
0.0%
1 jan 1973 ano
80.818
+7.514
10.25%
1 jan 1974 ano
82.128
+1.309
1.62%
1 jan 1975 ano
79.71
-2.418
-2.94%
1 jan 1976 ano
79.407
-0.303
-0.38%
1 jan 1977 ano
81.163
+1.756
2.21%
1 jan 1978 ano
82.724
+1.561
1.92%
1 jan 1979 ano
77.778
-4.946
-5.98%
1 jan 1980 ano
72.222
-5.556
-7.14%
1 jan 1981 ano
58.191
-14.032
-19.43%
1 jan 1982 ano
59.204
+1.014
1.74%
1 jan 1983 ano
60.366
+1.162
1.96%
1 jan 1984 ano
69.318
+8.952
14.83%
1 jan 1985 ano
66.534
-2.783
-4.02%
1 jan 1986 ano
70.862
+4.328
6.5%
1 jan 1987 ano
74.543
+3.681
5.19%
1 jan 1988 ano
77.128
+2.585
3.47%
1 jan 1989 ano
73.604
-3.524
-4.57%
1 jan 1990 ano
50.694
-22.91
-31.13%
1 jan 1991 ano
38.152
-12.541
-24.74%
1 jan 1992 ano
31.412
-6.741
-17.67%
1 jan 1993 ano
25.523
-5.889
-18.75%
1 jan 1994 ano
25.295
-0.227
-0.89%
1 jan 1995 ano
24.78
-0.515
-2.04%
1 jan 1996 ano
27.758
+2.978
12.02%
1 jan 1997 ano
29.131
+1.373
4.95%
1 jan 1998 ano
39.071
+9.939
34.12%
1 jan 1999 ano
48.843
+9.772
25.01%
1 jan 2000 ano
41.534
-7.309
-14.96%
1 jan 2001 ano
45.217
+3.683
8.87%
1 jan 2002 ano
40.506
-4.711
-10.42%
1 jan 2003 ano
49.162
+8.656
21.37%
1 jan 2004 ano
53.608
+4.446
9.04%
1 jan 2005 ano
61.44
+7.833
14.61%
1 jan 2006 ano
68.326
+6.886
11.21%
1 jan 2007 ano
66.156
-2.17
-3.18%
1 jan 2008 ano
65.506
-0.651
-0.98%
1 jan 2009 ano
64.519
-0.987
-1.51%
1 jan 2010 ano
63.868
-0.651
-1.01%
1 jan 2011 ano
70.86
+6.992
10.95%
1 jan 2012 ano
61.002
-9.858
-13.91%
1 jan 2013 ano
55.763
-5.239
-8.59%
1 jan 2014 ano
54.911
-0.852
-1.53%
Classificação de países por estatísticas atuais por anos


Comentários: