29
/pt/
pt
AIzaSyAYiBZKx7MnpbEhh9jyipgxe19OcubqV5w
April 1, 2024
260774
Tanzania
TZA
true
2
1
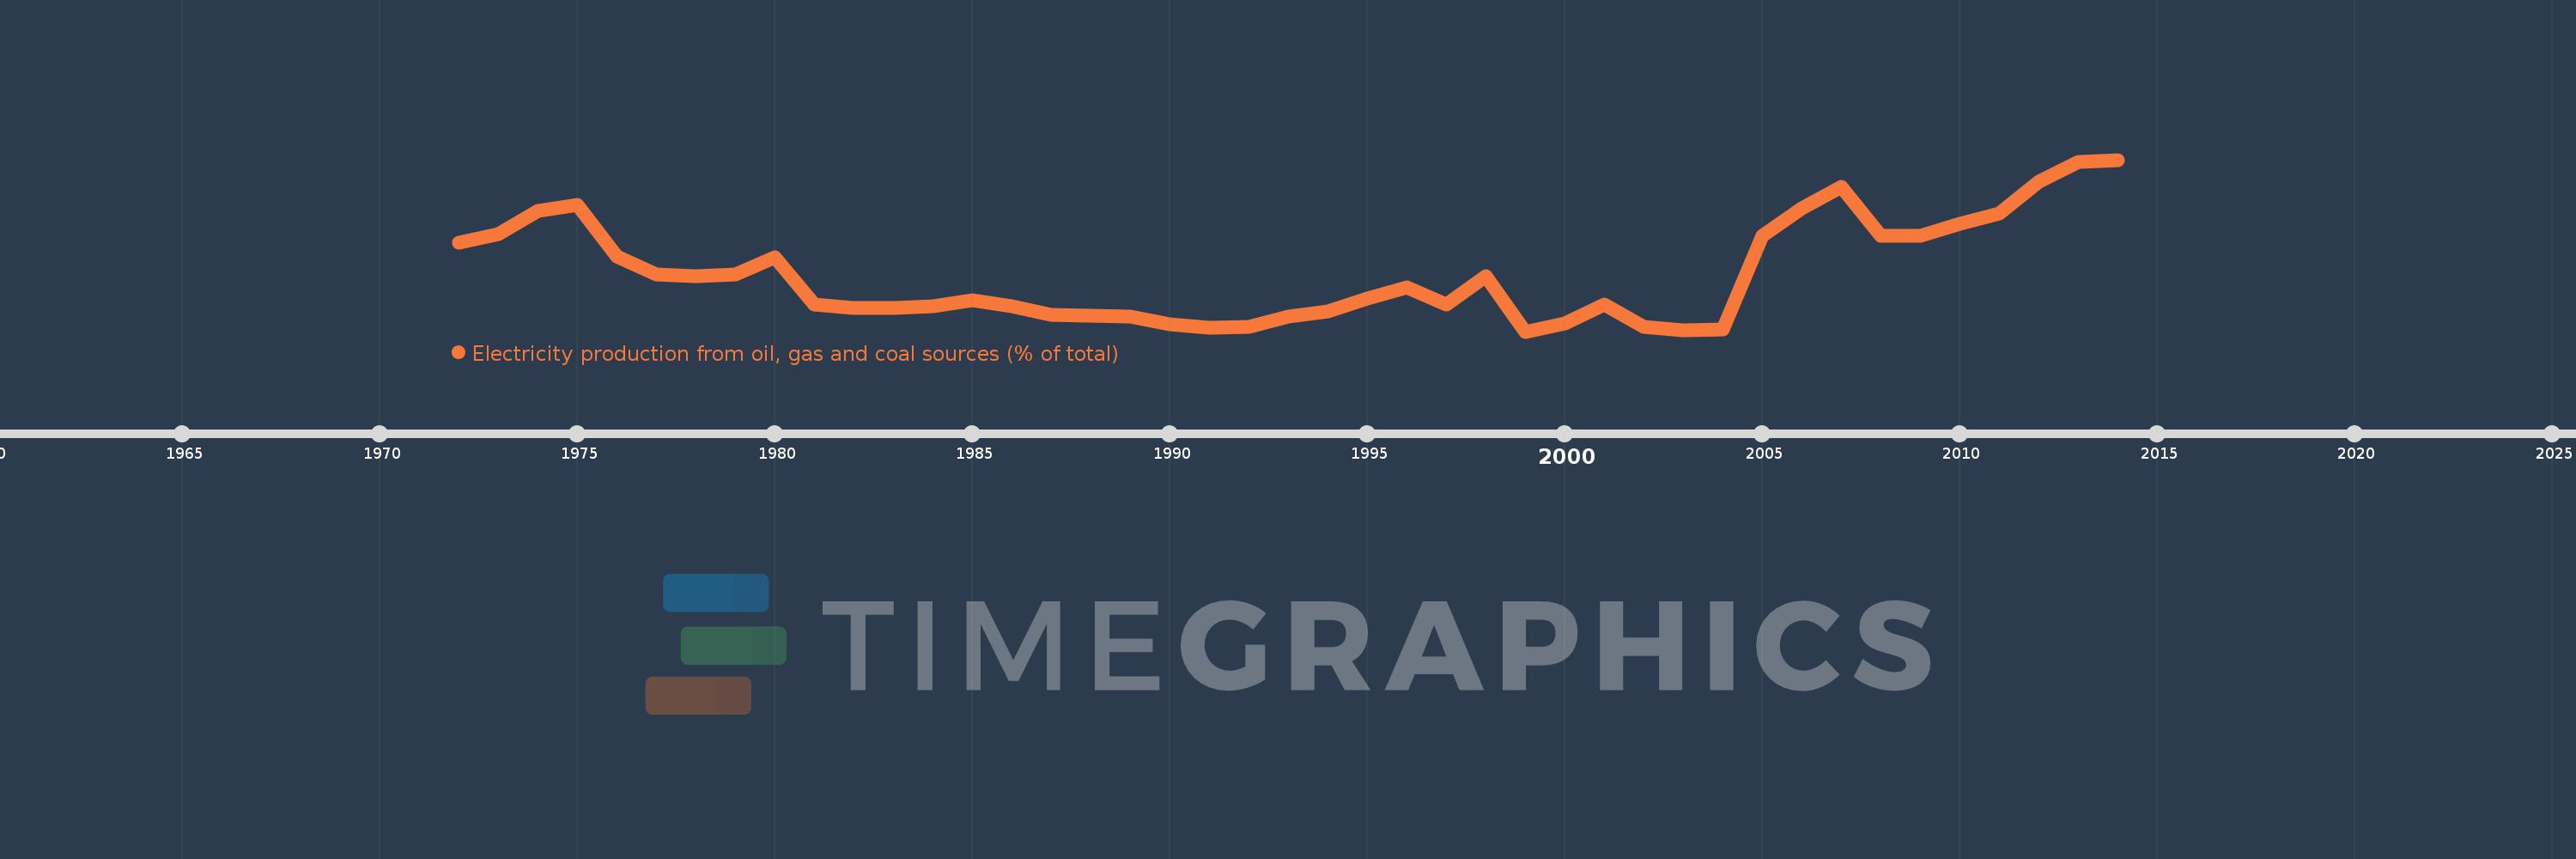
Electricity production from oil, gas and coal sources (% of total)
2014,2013,2012,2011,2010,2009,2008,2007,2006,2005,2004,2003,2002,2001,2000,1999,1998,1997,1996,1995,1994,1993,1992,1991,1990,1989,1988,1987,1986,1985,1984,1983,1982,1981,1980,1979,1978,1977,1976,1975,1974,1973,1972
Estas estatísticas em outros países:
AlbaniaAlgeriaAngolaArab WorldArgentinaArmeniaAustraliaAustriaAzerbaijanBahrainBangladeshBelarusBelgiumBeninBoliviaBosnia and HerzegovinaBotswanaBrazilBrunei DarussalamBulgariaCambodiaCameroonCanadaCentral Europe and the BalticsChileChinaColombiaCongo, Dem. Rep.Congo, Rep.Costa RicaCote d'IvoireCroatiaCubaCuracaoCyprusCzech RepublicDenmarkDominican RepublicEarly-demographic dividendEast Asia & PacificEast Asia & Pacific (excluding high income)East Asia & Pacific (IDA & IBRD countries)EcuadorEgypt, Arab Rep.El SalvadorEritreaEstoniaEthiopiaEuro areaEurope & Central AsiaEurope & Central Asia (excluding high income)Europe & Central Asia (IDA & IBRD countries)European UnionFinlandFragile and conflict affected situationsFranceGabonGeorgiaGermanyGhanaGibraltarGreeceGuatemalaHaitiHeavily indebted poor countries (HIPC)High incomeHondurasHong Kong SAR, ChinaHungaryIBRD onlyIcelandIDA & IBRD totalIDA blendIDA onlyIDA totalIndiaIndonesiaIran, Islamic Rep.IraqIrelandIsraelItalyJamaicaJapanJordanKazakhstanKenyaKorea, Dem. People’s Rep.Korea, Rep.KosovoKuwaitKyrgyz RepublicLate-demographic dividendLatin America & Caribbean Latin America & Caribbean (excluding high income)Latin America & the Caribbean (IDA & IBRD countries)LatviaLeast developed countries: UN classificationLebanonLibyaLithuaniaLow & middle incomeLower middle incomeLuxembourgMacedonia, FYRMalaysiaMaltaMauritiusMexicoMiddle East & North AfricaMiddle East & North Africa (excluding high income)Middle East & North Africa (IDA & IBRD countries)Middle incomeMoldovaMongoliaMontenegroMoroccoMozambiqueMyanmarNamibiaNepalNetherlandsNew ZealandNicaraguaNigerNigeriaNorth AmericaNorwayOECD membersOmanOther small statesPakistanPanamaParaguayPeruPhilippinesPolandPortugalPost-demographic dividendPre-demographic dividendQatarRomaniaRussian FederationSaudi ArabiaSenegalSerbiaSingaporeSlovak RepublicSloveniaSmall statesSouth AfricaSouth AsiaSouth Asia (IDA & IBRD)South SudanSpainSri LankaSub-Saharan Africa Sub-Saharan Africa (excluding high income)Sub-Saharan Africa (IDA & IBRD countries)SudanSwedenSwitzerlandSyrian Arab RepublicTajikistanTanzaniaThailandTogoTrinidad and TobagoTunisiaTurkeyTurkmenistanUkraineUnited Arab EmiratesUnited KingdomUnited StatesUpper middle incomeUruguayUzbekistanVenezuela, RBVietnamWorldYemen, Rep.ZambiaZimbabwe Linha do tempo:
Nesta escala de tempo está apresentado um gráfico de 1972 ano até 2014 ano Tanzania. Dados de 1971 ano ausente. O número de observações reais por data: 43.
Fonte (nome):
Indicadores de desenvolvimento mundial
Fonte (organização):
IEA Statistics © OECD/IEA 2014 (http://www.iea.org/stats/index.asp), subject to https://www.iea.org/t&c/termsandconditions/
Categorias:
Energy & Mining, Environment
Foi atualizado:
23 abr 2017 ano
Indicadores de alterações dos valores ao longo dos anos
Mínimo:
3.349
1 jan 1999 ano
Máximo:
68.55
1 jan 2014 ano
Na data de observação
Valor
Mudança absoluta
A alteração em relação ao valor anterior
1 jan 1972 ano
37.067
+37.067
0.0%
1 jan 1973 ano
40.223
+3.156
8.51%
1 jan 1974 ano
49.141
+8.917
22.17%
1 jan 1975 ano
51.405
+2.264
4.61%
1 jan 1976 ano
31.912
-19.493
-37.92%
1 jan 1977 ano
24.925
-6.987
-21.89%
1 jan 1978 ano
24.309
-0.616
-2.47%
1 jan 1979 ano
25.18
+0.871
3.58%
1 jan 1980 ano
31.641
+6.461
25.66%
1 jan 1981 ano
13.636
-18.004
-56.9%
1 jan 1982 ano
12.257
-1.379
-10.11%
1 jan 1983 ano
12.41
+0.152
1.24%
1 jan 1984 ano
12.956
+0.547
4.41%
1 jan 1985 ano
15.184
+2.228
17.2%
1 jan 1986 ano
12.808
-2.377
-15.65%
1 jan 1987 ano
9.773
-3.035
-23.69%
1 jan 1988 ano
9.513
-0.261
-2.67%
1 jan 1989 ano
9.144
-0.369
-3.88%
1 jan 1990 ano
5.964
-3.179
-34.77%
1 jan 1991 ano
4.853
-1.112
-18.64%
1 jan 1992 ano
5.269
+0.416
8.58%
1 jan 1993 ano
9.141
+3.872
73.49%
1 jan 1994 ano
11.152
+2.011
22.0%
1 jan 1995 ano
15.834
+4.682
41.98%
1 jan 1996 ano
20.01
+4.177
26.38%
1 jan 1997 ano
13.722
-6.289
-31.43%
1 jan 1998 ano
24.492
+10.77
78.49%
1 jan 1999 ano
3.349
-21.143
-86.33%
1 jan 2000 ano
6.285
+2.936
87.68%
1 jan 2001 ano
13.633
+7.347
116.9%
1 jan 2002 ano
5.206
-8.426
-61.81%
1 jan 2003 ano
3.751
-1.456
-27.96%
1 jan 2004 ano
4.137
+0.386
10.29%
1 jan 2005 ano
39.754
+35.617
860.97%
1 jan 2006 ano
49.986
+10.232
25.74%
1 jan 2007 ano
58.324
+8.338
16.68%
1 jan 2008 ano
39.627
-18.697
-32.06%
1 jan 2009 ano
39.576
-0.051
-0.13%
1 jan 2010 ano
44.21
+4.634
11.71%
1 jan 2011 ano
48.312
+4.102
9.28%
1 jan 2012 ano
60.2
+11.888
24.61%
1 jan 2013 ano
67.812
+7.611
12.64%
1 jan 2014 ano
68.55
+0.739
1.09%
Classificação de países por estatísticas atuais por anos


Comentários: