29
/pt/
pt
AIzaSyAYiBZKx7MnpbEhh9jyipgxe19OcubqV5w
April 1, 2024
223444
Philippines
PHL
true
2
1
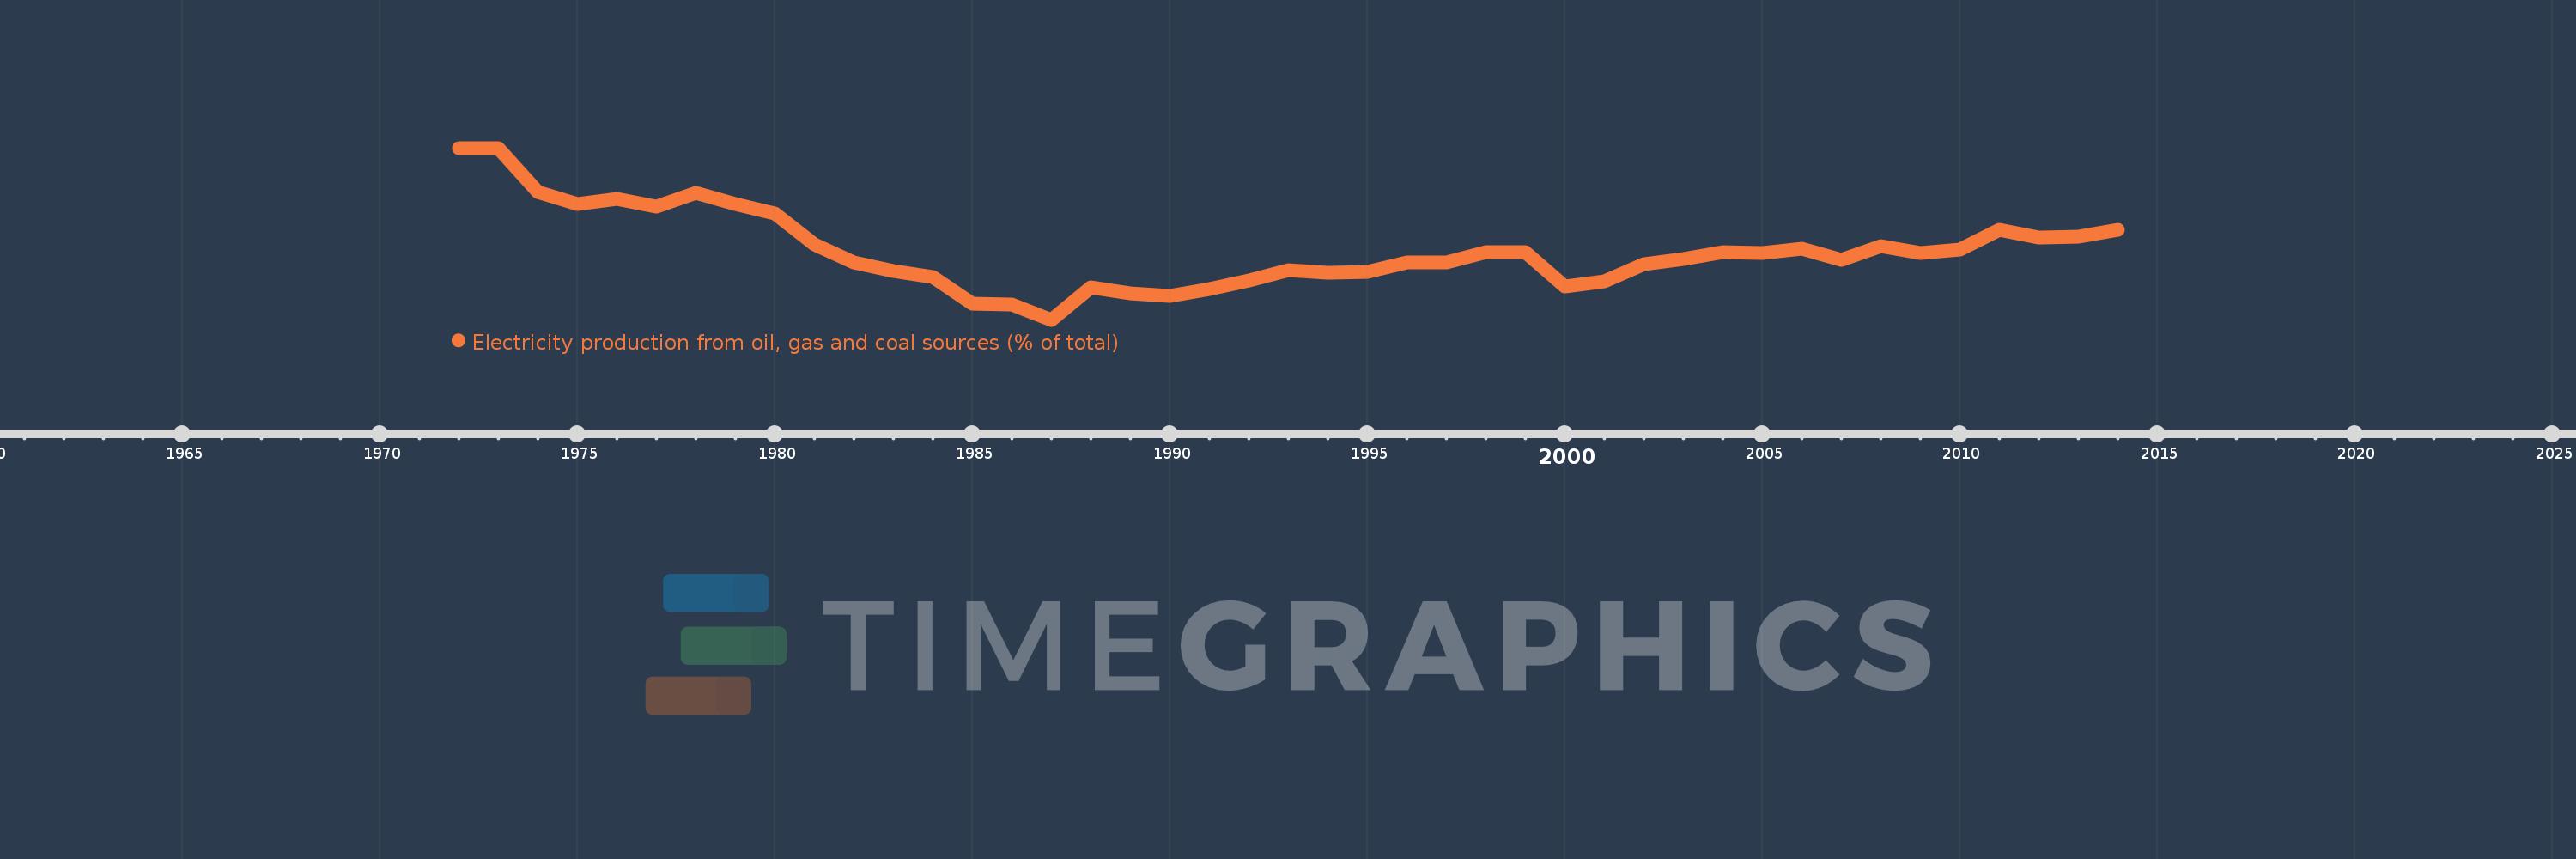
Electricity production from oil, gas and coal sources (% of total)
2014,2013,2012,2011,2010,2009,2008,2007,2006,2005,2004,2003,2002,2001,2000,1999,1998,1997,1996,1995,1994,1993,1992,1991,1990,1989,1988,1987,1986,1985,1984,1983,1982,1981,1980,1979,1978,1977,1976,1975,1974,1973,1972
Estas estatísticas em outros países:
AlbaniaAlgeriaAngolaArab WorldArgentinaArmeniaAustraliaAustriaAzerbaijanBahrainBangladeshBelarusBelgiumBeninBoliviaBosnia and HerzegovinaBotswanaBrazilBrunei DarussalamBulgariaCambodiaCameroonCanadaCentral Europe and the BalticsChileChinaColombiaCongo, Dem. Rep.Congo, Rep.Costa RicaCote d'IvoireCroatiaCubaCuracaoCyprusCzech RepublicDenmarkDominican RepublicEarly-demographic dividendEast Asia & PacificEast Asia & Pacific (excluding high income)East Asia & Pacific (IDA & IBRD countries)EcuadorEgypt, Arab Rep.El SalvadorEritreaEstoniaEthiopiaEuro areaEurope & Central AsiaEurope & Central Asia (excluding high income)Europe & Central Asia (IDA & IBRD countries)European UnionFinlandFragile and conflict affected situationsFranceGabonGeorgiaGermanyGhanaGibraltarGreeceGuatemalaHaitiHeavily indebted poor countries (HIPC)High incomeHondurasHong Kong SAR, ChinaHungaryIBRD onlyIcelandIDA & IBRD totalIDA blendIDA onlyIDA totalIndiaIndonesiaIran, Islamic Rep.IraqIrelandIsraelItalyJamaicaJapanJordanKazakhstanKenyaKorea, Dem. People’s Rep.Korea, Rep.KosovoKuwaitKyrgyz RepublicLate-demographic dividendLatin America & Caribbean Latin America & Caribbean (excluding high income)Latin America & the Caribbean (IDA & IBRD countries)LatviaLeast developed countries: UN classificationLebanonLibyaLithuaniaLow & middle incomeLower middle incomeLuxembourgMacedonia, FYRMalaysiaMaltaMauritiusMexicoMiddle East & North AfricaMiddle East & North Africa (excluding high income)Middle East & North Africa (IDA & IBRD countries)Middle incomeMoldovaMongoliaMontenegroMoroccoMozambiqueMyanmarNamibiaNepalNetherlandsNew ZealandNicaraguaNigerNigeriaNorth AmericaNorwayOECD membersOmanOther small statesPakistanPanamaParaguayPeruPhilippinesPolandPortugalPost-demographic dividendPre-demographic dividendQatarRomaniaRussian FederationSaudi ArabiaSenegalSerbiaSingaporeSlovak RepublicSloveniaSmall statesSouth AfricaSouth AsiaSouth Asia (IDA & IBRD)South SudanSpainSri LankaSub-Saharan Africa Sub-Saharan Africa (excluding high income)Sub-Saharan Africa (IDA & IBRD countries)SudanSwedenSwitzerlandSyrian Arab RepublicTajikistanTanzaniaThailandTogoTrinidad and TobagoTunisiaTurkeyTurkmenistanUkraineUnited Arab EmiratesUnited KingdomUnited StatesUpper middle incomeUruguayUzbekistanVenezuela, RBVietnamWorldYemen, Rep.ZambiaZimbabwe Linha do tempo:
Nesta escala de tempo está apresentado um gráfico de 1972 ano até 2014 ano Philippines. Dados de 1971 ano ausente. O número de observações reais por data: 43.
Fonte (nome):
Indicadores de desenvolvimento mundial
Fonte (organização):
IEA Statistics © OECD/IEA 2014 (http://www.iea.org/stats/index.asp), subject to https://www.iea.org/t&c/termsandconditions/
Categorias:
Energy & Mining, Environment
Foi atualizado:
23 abr 2017 ano
Indicadores de alterações dos valores ao longo dos anos
Mínimo:
44.746
1 jan 1987 ano
Máximo:
100.0
1 jan 1972 ano
Na data de observação
Valor
Mudança absoluta
A alteração em relação ao valor anterior
1 jan 1972 ano
100.0
+100.0
0.0%
1 jan 1973 ano
100.0
0.0
0.0%
1 jan 1974 ano
85.78
-14.22
-14.22%
1 jan 1975 ano
81.912
-3.869
-4.51%
1 jan 1976 ano
83.541
+1.629
1.99%
1 jan 1977 ano
81.014
-2.527
-3.02%
1 jan 1978 ano
85.431
+4.417
5.45%
1 jan 1979 ano
81.926
-3.505
-4.1%
1 jan 1980 ano
78.965
-2.961
-3.61%
1 jan 1981 ano
68.91
-10.055
-12.73%
1 jan 1982 ano
63.198
-5.712
-8.29%
1 jan 1983 ano
60.543
-2.654
-4.2%
1 jan 1984 ano
58.525
-2.018
-3.33%
1 jan 1985 ano
49.778
-8.747
-14.95%
1 jan 1986 ano
49.609
-0.169
-0.34%
1 jan 1987 ano
44.746
-4.863
-9.8%
1 jan 1988 ano
55.159
+10.413
23.27%
1 jan 1989 ano
53.197
-1.962
-3.56%
1 jan 1990 ano
52.317
-0.88
-1.65%
1 jan 1991 ano
54.575
+2.258
4.32%
1 jan 1992 ano
57.492
+2.916
5.34%
1 jan 1993 ano
60.804
+3.312
5.76%
1 jan 1994 ano
59.754
-1.05
-1.73%
1 jan 1995 ano
60.021
+0.267
0.45%
1 jan 1996 ano
63.156
+3.135
5.22%
1 jan 1997 ano
63.068
-0.088
-0.14%
1 jan 1998 ano
66.565
+3.497
5.55%
1 jan 1999 ano
66.376
-0.189
-0.28%
1 jan 2000 ano
55.508
-10.869
-16.37%
1 jan 2001 ano
57.11
+1.602
2.89%
1 jan 2002 ano
62.708
+5.598
9.8%
1 jan 2003 ano
64.357
+1.649
2.63%
1 jan 2004 ano
66.581
+2.224
3.46%
1 jan 2005 ano
66.269
-0.312
-0.47%
1 jan 2006 ano
67.635
+1.366
2.06%
1 jan 2007 ano
63.972
-3.663
-5.42%
1 jan 2008 ano
68.4
+4.429
6.92%
1 jan 2009 ano
66.084
-2.316
-3.39%
1 jan 2010 ano
67.415
+1.331
2.01%
1 jan 2011 ano
73.691
+6.276
9.31%
1 jan 2012 ano
71.312
-2.379
-3.23%
1 jan 2013 ano
71.531
+0.219
0.31%
1 jan 2014 ano
73.556
+2.026
2.83%
Classificação de países por estatísticas atuais por anos


Comentários: