29
/pt/
pt
AIzaSyAYiBZKx7MnpbEhh9jyipgxe19OcubqV5w
April 1, 2024
274672
United Arab Emirates
ARE
true
2
1
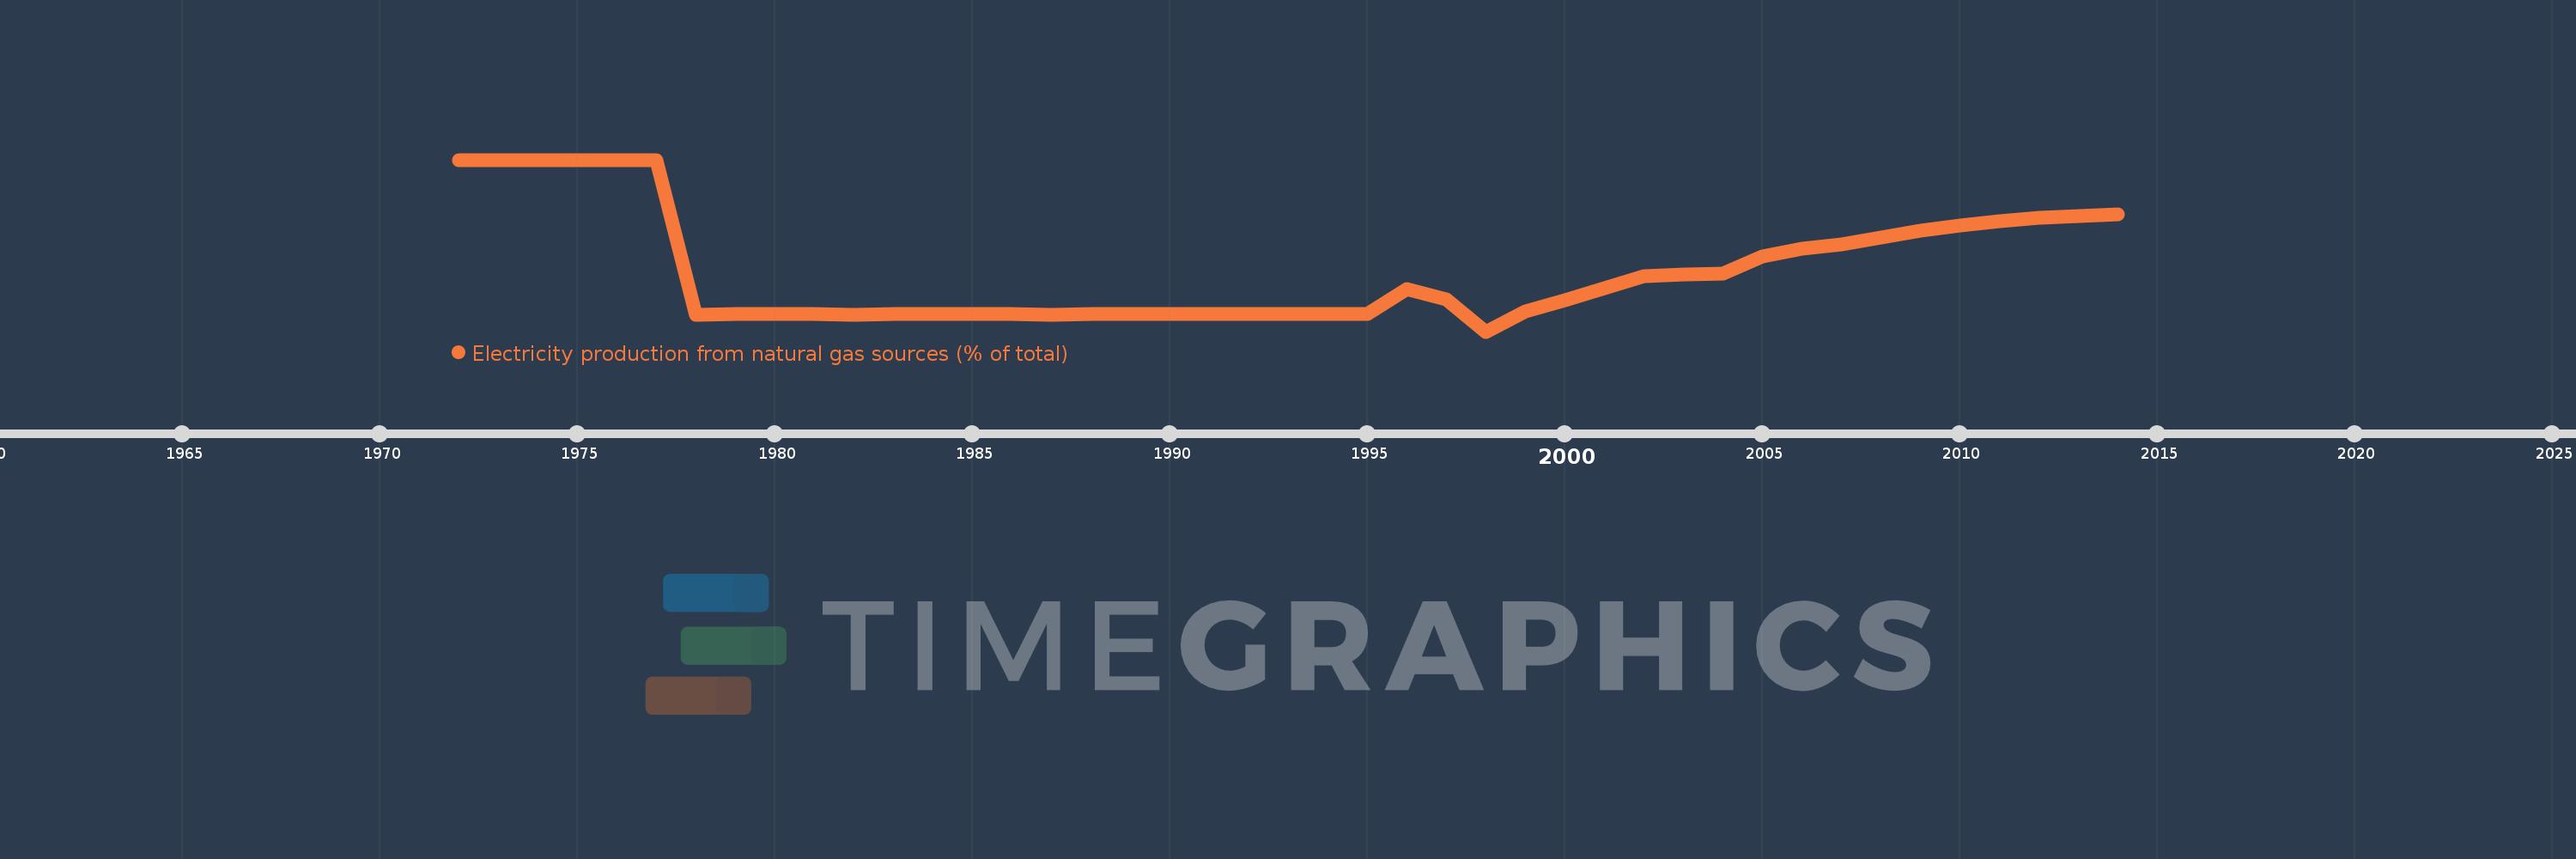
Electricity production from natural gas sources (% of total)
2014,2013,2012,2011,2010,2009,2008,2007,2006,2005,2004,2003,2002,2001,2000,1999,1998,1997,1996,1995,1994,1993,1992,1991,1990,1989,1988,1987,1986,1985,1984,1983,1982,1981,1980,1979,1978,1977,1976,1975,1974,1973,1972
Estas estatísticas em outros países:
AlbaniaAlgeriaAngolaArab WorldArgentinaArmeniaAustraliaAustriaAzerbaijanBahrainBangladeshBelarusBelgiumBeninBoliviaBosnia and HerzegovinaBotswanaBrazilBrunei DarussalamBulgariaCambodiaCameroonCanadaCentral Europe and the BalticsChileChinaColombiaCongo, Dem. Rep.Congo, Rep.Costa RicaCote d'IvoireCroatiaCubaCuracaoCyprusCzech RepublicDenmarkDominican RepublicEarly-demographic dividendEast Asia & PacificEast Asia & Pacific (excluding high income)East Asia & Pacific (IDA & IBRD countries)EcuadorEgypt, Arab Rep.El SalvadorEritreaEstoniaEthiopiaEuro areaEurope & Central AsiaEurope & Central Asia (excluding high income)Europe & Central Asia (IDA & IBRD countries)European UnionFinlandFragile and conflict affected situationsFranceGabonGeorgiaGermanyGhanaGibraltarGreeceGuatemalaHaitiHeavily indebted poor countries (HIPC)High incomeHondurasHong Kong SAR, ChinaHungaryIBRD onlyIcelandIDA & IBRD totalIDA blendIDA onlyIDA totalIndiaIndonesiaIran, Islamic Rep.IraqIrelandIsraelItalyJamaicaJapanJordanKazakhstanKenyaKorea, Dem. People’s Rep.Korea, Rep.KosovoKuwaitKyrgyz RepublicLate-demographic dividendLatin America & Caribbean Latin America & Caribbean (excluding high income)Latin America & the Caribbean (IDA & IBRD countries)LatviaLeast developed countries: UN classificationLebanonLibyaLithuaniaLow & middle incomeLower middle incomeLuxembourgMacedonia, FYRMalaysiaMaltaMauritiusMexicoMiddle East & North AfricaMiddle East & North Africa (excluding high income)Middle East & North Africa (IDA & IBRD countries)Middle incomeMoldovaMongoliaMontenegroMoroccoMozambiqueMyanmarNamibiaNepalNetherlandsNew ZealandNicaraguaNigerNigeriaNorth AmericaNorwayOECD membersOmanOther small statesPakistanPanamaParaguayPeruPhilippinesPolandPortugalPost-demographic dividendPre-demographic dividendQatarRomaniaRussian FederationSaudi ArabiaSenegalSerbiaSingaporeSlovak RepublicSloveniaSmall statesSouth AfricaSouth AsiaSouth Asia (IDA & IBRD)South SudanSpainSri LankaSub-Saharan Africa Sub-Saharan Africa (excluding high income)Sub-Saharan Africa (IDA & IBRD countries)SudanSwedenSwitzerlandSyrian Arab RepublicTajikistanTanzaniaThailandTogoTrinidad and TobagoTunisiaTurkeyTurkmenistanUkraineUnited Arab EmiratesUnited KingdomUnited StatesUpper middle incomeUruguayUzbekistanVenezuela, RBVietnamWorldYemen, Rep.ZambiaZimbabwe Linha do tempo:
Nesta escala de tempo está apresentado um gráfico de 1972 ano até 2014 ano United Arab Emirates. Dados de 1971 ano ausente. O número de observações reais por data: 43.
Fonte (nome):
Indicadores de desenvolvimento mundial
Fonte (organização):
IEA Statistics © OECD/IEA 2014 (http://www.iea.org/stats/index.asp), subject to https://www.iea.org/t&c/termsandconditions/
Categorias:
Energy & Mining, Climate Change, Infrastructure
Foi atualizado:
23 abr 2017 ano
Indicadores de alterações dos valores ao longo dos anos
Mínimo:
95.866
1 jan 1998 ano
Máximo:
100.0
1 jan 1972 ano
Na data de observação
Valor
Mudança absoluta
A alteração em relação ao valor anterior
1 jan 1972 ano
100.0
+100.0
0.0%
1 jan 1973 ano
100.0
0.0
0.0%
1 jan 1974 ano
100.0
0.0
0.0%
1 jan 1975 ano
100.0
0.0
0.0%
1 jan 1976 ano
100.0
0.0
0.0%
1 jan 1977 ano
100.0
0.0
0.0%
1 jan 1978 ano
96.277
-3.723
-3.72%
1 jan 1979 ano
96.281
+0.003
0.0%
1 jan 1980 ano
96.293
+0.013
0.01%
1 jan 1981 ano
96.289
-0.004
0.0%
1 jan 1982 ano
96.272
-0.017
-0.02%
1 jan 1983 ano
96.287
+0.015
0.02%
1 jan 1984 ano
96.282
-0.005
0.0%
1 jan 1985 ano
96.282
-0.001
0.0%
1 jan 1986 ano
96.292
+0.01
0.01%
1 jan 1987 ano
96.278
-0.014
-0.01%
1 jan 1988 ano
96.288
+0.01
0.01%
1 jan 1989 ano
96.28
-0.007
-0.01%
1 jan 1990 ano
96.298
+0.017
0.02%
1 jan 1991 ano
96.294
-0.004
0.0%
1 jan 1992 ano
96.294
+0.0
0.0%
1 jan 1993 ano
96.297
+0.003
0.0%
1 jan 1994 ano
96.291
-0.006
-0.01%
1 jan 1995 ano
96.293
+0.002
0.0%
1 jan 1996 ano
96.894
+0.601
0.62%
1 jan 1997 ano
96.632
-0.262
-0.27%
1 jan 1998 ano
95.866
-0.766
-0.79%
1 jan 1999 ano
96.349
+0.483
0.5%
1 jan 2000 ano
96.612
+0.262
0.27%
1 jan 2001 ano
96.911
+0.299
0.31%
1 jan 2002 ano
97.202
+0.291
0.3%
1 jan 2003 ano
97.236
+0.034
0.04%
1 jan 2004 ano
97.256
+0.02
0.02%
1 jan 2005 ano
97.665
+0.409
0.42%
1 jan 2006 ano
97.865
+0.2
0.2%
1 jan 2007 ano
97.968
+0.103
0.1%
1 jan 2008 ano
98.137
+0.169
0.17%
1 jan 2009 ano
98.295
+0.158
0.16%
1 jan 2010 ano
98.411
+0.117
0.12%
1 jan 2011 ano
98.521
+0.11
0.11%
1 jan 2012 ano
98.6
+0.079
0.08%
1 jan 2013 ano
98.642
+0.042
0.04%
1 jan 2014 ano
98.689
+0.046
0.05%
Classificação de países por estatísticas atuais por anos


Comentários: