29
/pt/
pt
AIzaSyAYiBZKx7MnpbEhh9jyipgxe19OcubqV5w
April 1, 2024
212843
Nigeria
NGA
true
2
1
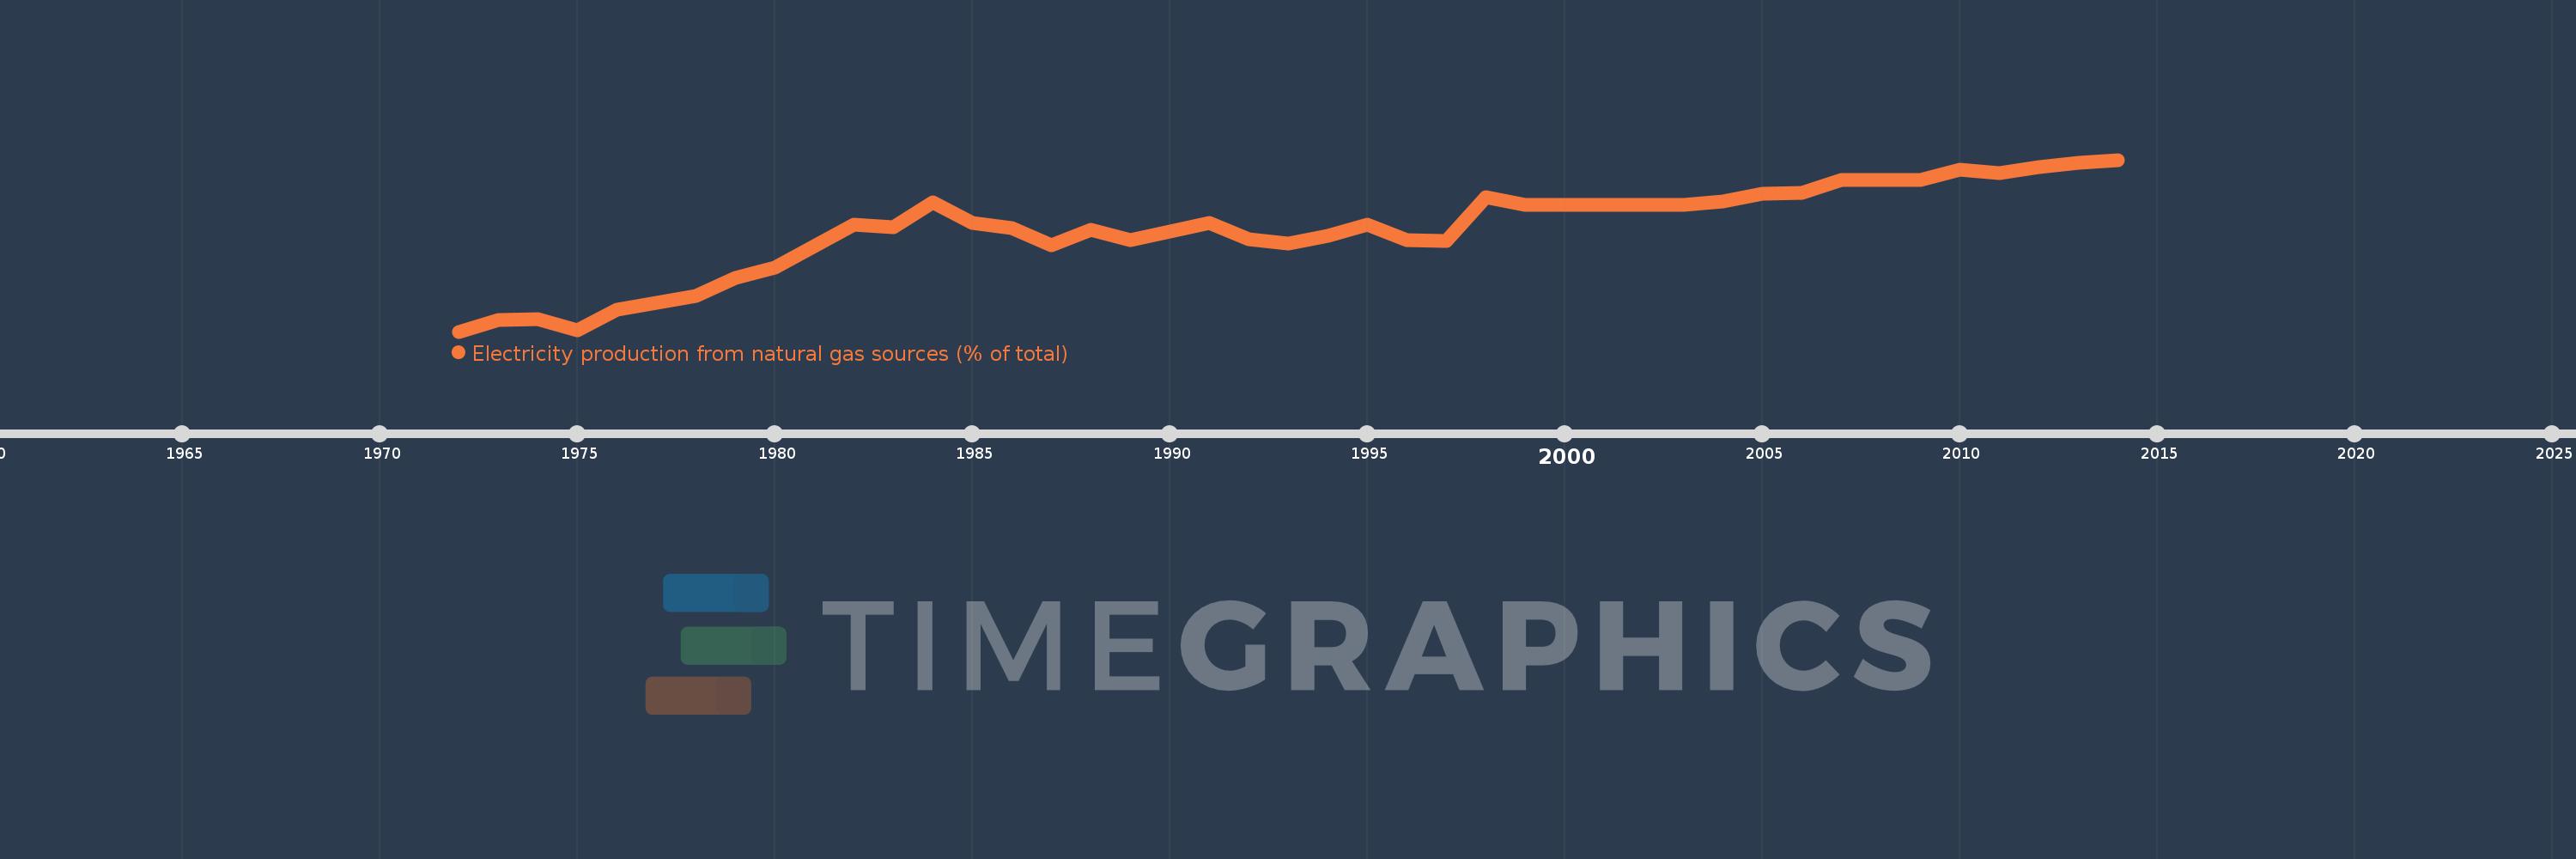
Electricity production from natural gas sources (% of total)
2014,2013,2012,2011,2010,2009,2008,2007,2006,2005,2004,2003,2002,2001,2000,1999,1998,1997,1996,1995,1994,1993,1992,1991,1990,1989,1988,1987,1986,1985,1984,1983,1982,1981,1980,1979,1978,1977,1976,1975,1974,1973,1972
Estas estatísticas em outros países:
AlbaniaAlgeriaAngolaArab WorldArgentinaArmeniaAustraliaAustriaAzerbaijanBahrainBangladeshBelarusBelgiumBeninBoliviaBosnia and HerzegovinaBotswanaBrazilBrunei DarussalamBulgariaCambodiaCameroonCanadaCentral Europe and the BalticsChileChinaColombiaCongo, Dem. Rep.Congo, Rep.Costa RicaCote d'IvoireCroatiaCubaCuracaoCyprusCzech RepublicDenmarkDominican RepublicEarly-demographic dividendEast Asia & PacificEast Asia & Pacific (excluding high income)East Asia & Pacific (IDA & IBRD countries)EcuadorEgypt, Arab Rep.El SalvadorEritreaEstoniaEthiopiaEuro areaEurope & Central AsiaEurope & Central Asia (excluding high income)Europe & Central Asia (IDA & IBRD countries)European UnionFinlandFragile and conflict affected situationsFranceGabonGeorgiaGermanyGhanaGibraltarGreeceGuatemalaHaitiHeavily indebted poor countries (HIPC)High incomeHondurasHong Kong SAR, ChinaHungaryIBRD onlyIcelandIDA & IBRD totalIDA blendIDA onlyIDA totalIndiaIndonesiaIran, Islamic Rep.IraqIrelandIsraelItalyJamaicaJapanJordanKazakhstanKenyaKorea, Dem. People’s Rep.Korea, Rep.KosovoKuwaitKyrgyz RepublicLate-demographic dividendLatin America & Caribbean Latin America & Caribbean (excluding high income)Latin America & the Caribbean (IDA & IBRD countries)LatviaLeast developed countries: UN classificationLebanonLibyaLithuaniaLow & middle incomeLower middle incomeLuxembourgMacedonia, FYRMalaysiaMaltaMauritiusMexicoMiddle East & North AfricaMiddle East & North Africa (excluding high income)Middle East & North Africa (IDA & IBRD countries)Middle incomeMoldovaMongoliaMontenegroMoroccoMozambiqueMyanmarNamibiaNepalNetherlandsNew ZealandNicaraguaNigerNigeriaNorth AmericaNorwayOECD membersOmanOther small statesPakistanPanamaParaguayPeruPhilippinesPolandPortugalPost-demographic dividendPre-demographic dividendQatarRomaniaRussian FederationSaudi ArabiaSenegalSerbiaSingaporeSlovak RepublicSloveniaSmall statesSouth AfricaSouth AsiaSouth Asia (IDA & IBRD)South SudanSpainSri LankaSub-Saharan Africa Sub-Saharan Africa (excluding high income)Sub-Saharan Africa (IDA & IBRD countries)SudanSwedenSwitzerlandSyrian Arab RepublicTajikistanTanzaniaThailandTogoTrinidad and TobagoTunisiaTurkeyTurkmenistanUkraineUnited Arab EmiratesUnited KingdomUnited StatesUpper middle incomeUruguayUzbekistanVenezuela, RBVietnamWorldYemen, Rep.ZambiaZimbabwe Linha do tempo:
Nesta escala de tempo está apresentado um gráfico de 1972 ano até 2014 ano Nigeria. Dados de 1971 ano ausente. O número de observações reais por data: 43.
Fonte (nome):
Indicadores de desenvolvimento mundial
Fonte (organização):
IEA Statistics © OECD/IEA 2014 (http://www.iea.org/stats/index.asp), subject to https://www.iea.org/t&c/termsandconditions/
Categorias:
Energy & Mining, Climate Change, Infrastructure
Foi atualizado:
23 abr 2017 ano
Indicadores de alterações dos valores ao longo dos anos
Mínimo:
5.935
1 jan 1972 ano
Máximo:
81.61
1 jan 2014 ano
Na data de observação
Valor
Mudança absoluta
A alteração em relação ao valor anterior
1 jan 1972 ano
5.935
+5.935
0.0%
1 jan 1973 ano
11.042
+5.106
86.03%
1 jan 1974 ano
11.543
+0.501
4.54%
1 jan 1975 ano
6.559
-4.984
-43.18%
1 jan 1976 ano
15.733
+9.174
139.88%
1 jan 1977 ano
18.704
+2.971
18.88%
1 jan 1978 ano
21.536
+2.832
15.14%
1 jan 1979 ano
29.461
+7.924
36.8%
1 jan 1980 ano
34.087
+4.627
15.7%
1 jan 1981 ano
43.493
+9.406
27.59%
1 jan 1982 ano
53.215
+9.722
22.35%
1 jan 1983 ano
51.782
-1.433
-2.69%
1 jan 1984 ano
63.021
+11.239
21.71%
1 jan 1985 ano
53.907
-9.114
-14.46%
1 jan 1986 ano
51.443
-2.464
-4.57%
1 jan 1987 ano
43.823
-7.62
-14.81%
1 jan 1988 ano
50.91
+7.087
16.17%
1 jan 1989 ano
46.293
-4.617
-9.07%
1 jan 1990 ano
50.121
+3.828
8.27%
1 jan 1991 ano
53.651
+3.53
7.04%
1 jan 1992 ano
46.432
-7.219
-13.46%
1 jan 1993 ano
44.681
-1.751
-3.77%
1 jan 1994 ano
48.121
+3.44
7.7%
1 jan 1995 ano
53.178
+5.056
10.51%
1 jan 1996 ano
46.232
-6.946
-13.06%
1 jan 1997 ano
45.743
-0.489
-1.06%
1 jan 1998 ano
65.298
+19.555
42.75%
1 jan 1999 ano
61.783
-3.515
-5.38%
1 jan 2000 ano
61.788
+0.005
0.01%
1 jan 2001 ano
61.784
-0.003
0.0%
1 jan 2002 ano
61.784
-0.001
0.0%
1 jan 2003 ano
61.782
-0.001
0.0%
1 jan 2004 ano
63.099
+1.317
2.13%
1 jan 2005 ano
66.599
+3.5
5.55%
1 jan 2006 ano
66.999
+0.4
0.6%
1 jan 2007 ano
72.899
+5.9
8.81%
1 jan 2008 ano
72.9
+0.001
0.0%
1 jan 2009 ano
72.899
-0.001
0.0%
1 jan 2010 ano
77.1
+4.201
5.76%
1 jan 2011 ano
75.598
-1.501
-1.95%
1 jan 2012 ano
78.239
+2.64
3.49%
1 jan 2013 ano
80.286
+2.048
2.62%
1 jan 2014 ano
81.61
+1.323
1.65%
Classificação de países por estatísticas atuais por anos


Comentários: