29
/pt/
pt
AIzaSyAYiBZKx7MnpbEhh9jyipgxe19OcubqV5w
April 1, 2024
258217
Syrian Arab Republic
SYR
true
2
1
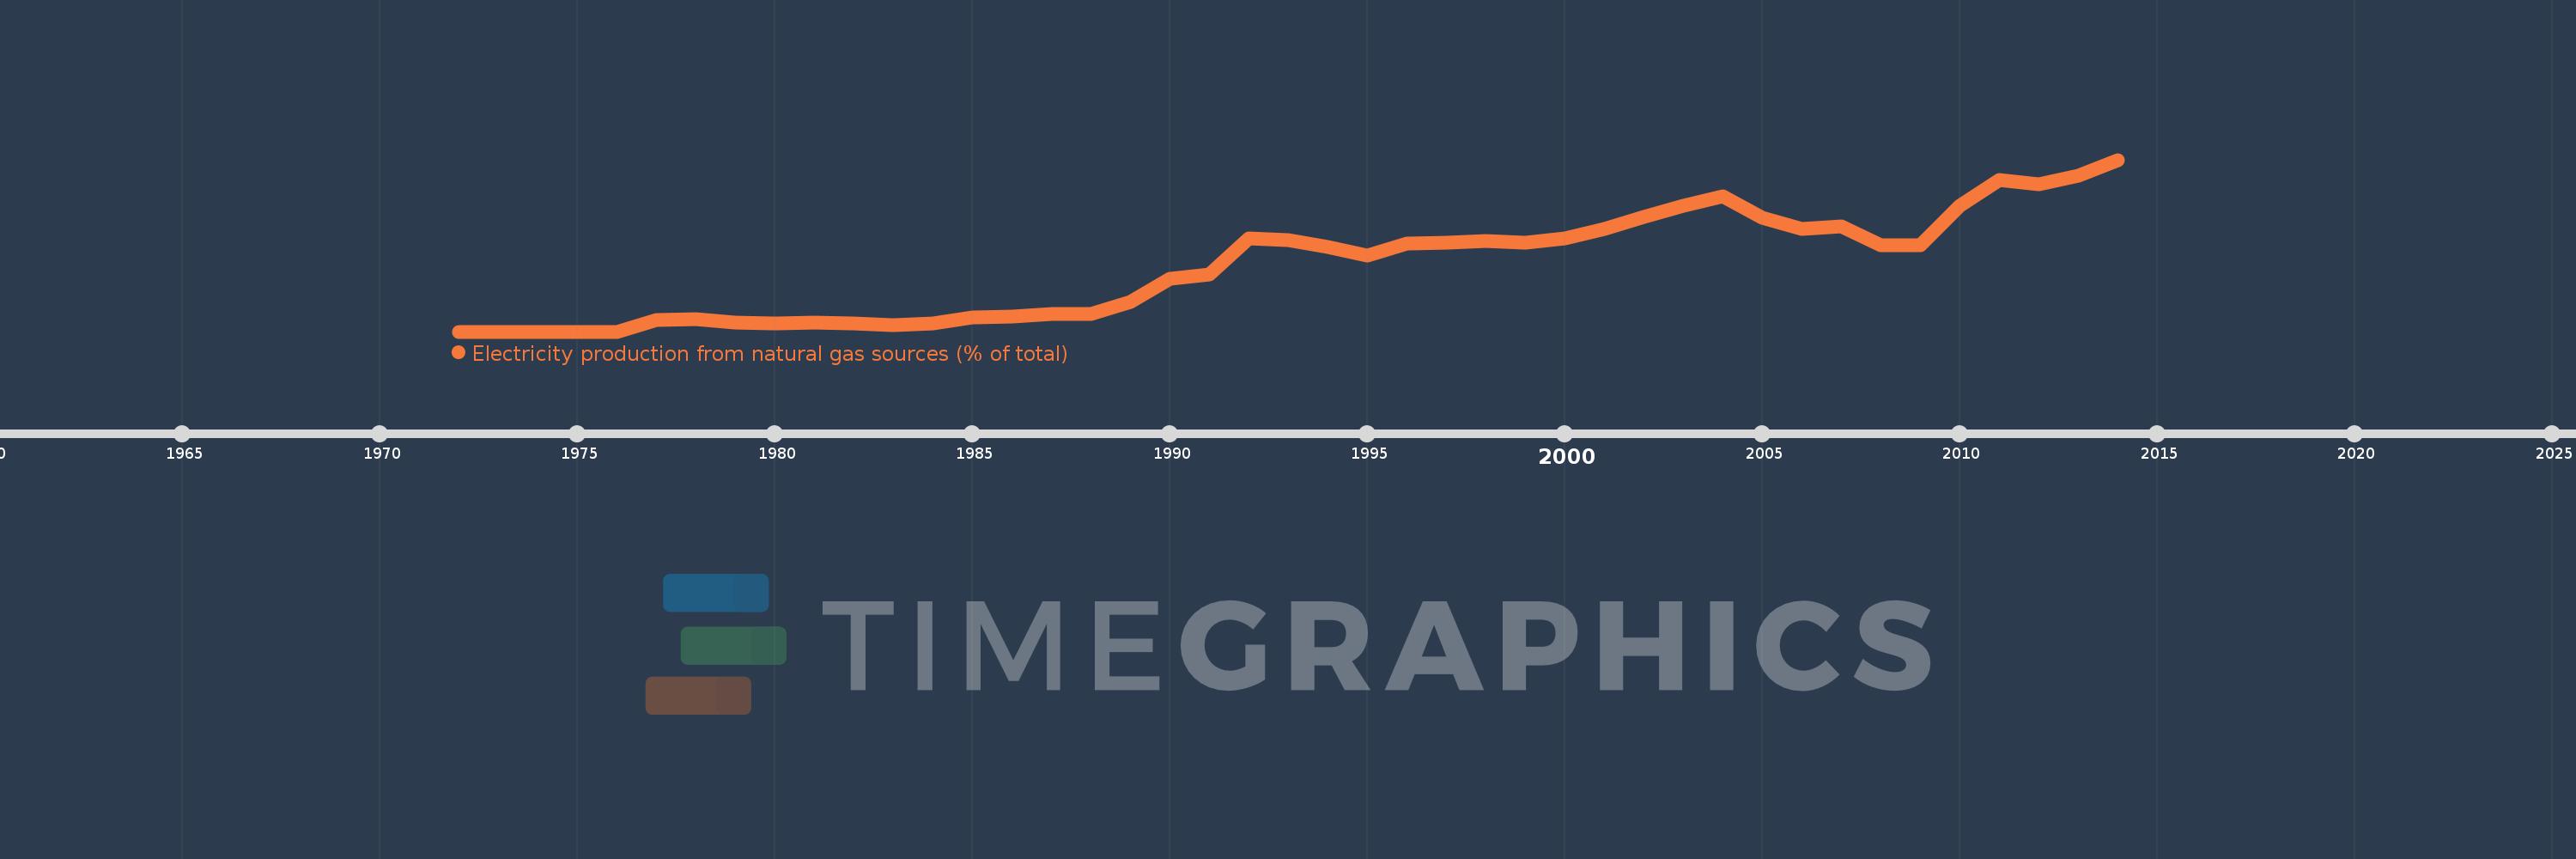
Electricity production from natural gas sources (% of total)
2014,2013,2012,2011,2010,2009,2008,2007,2006,2005,2004,2003,2002,2001,2000,1999,1998,1997,1996,1995,1994,1993,1992,1991,1990,1989,1988,1987,1986,1985,1984,1983,1982,1981,1980,1979,1978,1977,1976,1975,1974,1973,1972
Estas estatísticas em outros países:
AlbaniaAlgeriaAngolaArab WorldArgentinaArmeniaAustraliaAustriaAzerbaijanBahrainBangladeshBelarusBelgiumBeninBoliviaBosnia and HerzegovinaBotswanaBrazilBrunei DarussalamBulgariaCambodiaCameroonCanadaCentral Europe and the BalticsChileChinaColombiaCongo, Dem. Rep.Congo, Rep.Costa RicaCote d'IvoireCroatiaCubaCuracaoCyprusCzech RepublicDenmarkDominican RepublicEarly-demographic dividendEast Asia & PacificEast Asia & Pacific (excluding high income)East Asia & Pacific (IDA & IBRD countries)EcuadorEgypt, Arab Rep.El SalvadorEritreaEstoniaEthiopiaEuro areaEurope & Central AsiaEurope & Central Asia (excluding high income)Europe & Central Asia (IDA & IBRD countries)European UnionFinlandFragile and conflict affected situationsFranceGabonGeorgiaGermanyGhanaGibraltarGreeceGuatemalaHaitiHeavily indebted poor countries (HIPC)High incomeHondurasHong Kong SAR, ChinaHungaryIBRD onlyIcelandIDA & IBRD totalIDA blendIDA onlyIDA totalIndiaIndonesiaIran, Islamic Rep.IraqIrelandIsraelItalyJamaicaJapanJordanKazakhstanKenyaKorea, Dem. People’s Rep.Korea, Rep.KosovoKuwaitKyrgyz RepublicLate-demographic dividendLatin America & Caribbean Latin America & Caribbean (excluding high income)Latin America & the Caribbean (IDA & IBRD countries)LatviaLeast developed countries: UN classificationLebanonLibyaLithuaniaLow & middle incomeLower middle incomeLuxembourgMacedonia, FYRMalaysiaMaltaMauritiusMexicoMiddle East & North AfricaMiddle East & North Africa (excluding high income)Middle East & North Africa (IDA & IBRD countries)Middle incomeMoldovaMongoliaMontenegroMoroccoMozambiqueMyanmarNamibiaNepalNetherlandsNew ZealandNicaraguaNigerNigeriaNorth AmericaNorwayOECD membersOmanOther small statesPakistanPanamaParaguayPeruPhilippinesPolandPortugalPost-demographic dividendPre-demographic dividendQatarRomaniaRussian FederationSaudi ArabiaSenegalSerbiaSingaporeSlovak RepublicSloveniaSmall statesSouth AfricaSouth AsiaSouth Asia (IDA & IBRD)South SudanSpainSri LankaSub-Saharan Africa Sub-Saharan Africa (excluding high income)Sub-Saharan Africa (IDA & IBRD countries)SudanSwedenSwitzerlandSyrian Arab RepublicTajikistanTanzaniaThailandTogoTrinidad and TobagoTunisiaTurkeyTurkmenistanUkraineUnited Arab EmiratesUnited KingdomUnited StatesUpper middle incomeUruguayUzbekistanVenezuela, RBVietnamWorldYemen, Rep.ZambiaZimbabwe Linha do tempo:
Nesta escala de tempo está apresentado um gráfico de 1972 ano até 2014 ano Syrian Arab Republic. Dados de 1971 ano ausente. O número de observações reais por data: 43.
Fonte (nome):
Indicadores de desenvolvimento mundial
Fonte (organização):
IEA Statistics © OECD/IEA 2014 (http://www.iea.org/stats/index.asp), subject to https://www.iea.org/t&c/termsandconditions/
Categorias:
Energy & Mining, Climate Change, Infrastructure
Foi atualizado:
23 abr 2017 ano
Indicadores de alterações dos valores ao longo dos anos
Máximo:
62.176
1 jan 2014 ano
Na data de observação
Valor
Mudança absoluta
A alteração em relação ao valor anterior
1 jan 1972 ano
0.0
0.0
0.0%
1 jan 1977 ano
4.348
+4.348
%
1 jan 1978 ano
4.597
+0.249
5.74%
1 jan 1979 ano
3.344
-1.253
-27.26%
1 jan 1980 ano
2.856
-0.487
-14.58%
1 jan 1981 ano
3.384
+0.528
18.47%
1 jan 1982 ano
2.892
-0.492
-14.54%
1 jan 1983 ano
2.35
-0.542
-18.74%
1 jan 1984 ano
3.035
+0.686
29.18%
1 jan 1985 ano
4.979
+1.944
64.05%
1 jan 1986 ano
5.482
+0.503
10.1%
1 jan 1987 ano
6.359
+0.876
15.98%
1 jan 1988 ano
6.509
+0.15
2.36%
1 jan 1989 ano
10.578
+4.069
62.52%
1 jan 1990 ano
19.082
+8.503
80.39%
1 jan 1991 ano
20.541
+1.459
7.65%
1 jan 1992 ano
33.706
+13.165
64.09%
1 jan 1993 ano
33.195
-0.51
-1.51%
1 jan 1994 ano
30.519
-2.676
-8.06%
1 jan 1995 ano
27.539
-2.98
-9.76%
1 jan 1996 ano
31.727
+4.188
15.21%
1 jan 1997 ano
32.185
+0.458
1.44%
1 jan 1998 ano
32.913
+0.728
2.26%
1 jan 1999 ano
32.312
-0.601
-1.82%
1 jan 2000 ano
33.582
+1.269
3.93%
1 jan 2001 ano
37.102
+3.52
10.48%
1 jan 2002 ano
41.367
+4.265
11.5%
1 jan 2003 ano
45.49
+4.122
9.97%
1 jan 2004 ano
48.884
+3.395
7.46%
1 jan 2005 ano
41.182
-7.702
-15.76%
1 jan 2006 ano
37.112
-4.07
-9.88%
1 jan 2007 ano
38.052
+0.94
2.53%
1 jan 2008 ano
31.235
-6.817
-17.91%
1 jan 2009 ano
31.321
+0.086
0.28%
1 jan 2010 ano
45.675
+14.354
45.83%
1 jan 2011 ano
54.97
+9.294
20.35%
1 jan 2012 ano
53.366
-1.604
-2.92%
1 jan 2013 ano
56.557
+3.191
5.98%
1 jan 2014 ano
62.176
+5.619
9.93%
Classificação de países por estatísticas atuais por anos


Comentários: