29
/pt/
pt
AIzaSyAYiBZKx7MnpbEhh9jyipgxe19OcubqV5w
April 1, 2024
256918
Sweden
SWE
true
2
1
Total reserves in months of imports
2016,2015,2014,2013,2012,2011,2010,2009,2008,2007,2006,2005,2004,2003,2002,2001,2000,1999,1998,1997,1996,1995,1994,1993,1992,1991,1990,1989,1988,1987,1986,1985,1984,1983,1982,1981,1980,1979,1978,1977,1976,1975,1974,1973,1972,1971
Estas estatísticas em outros países:
AfghanistanAlbaniaAlgeriaAngolaAntigua and BarbudaArab WorldArgentinaArmeniaArubaAustraliaAustriaAzerbaijanBahamas, TheBahrainBangladeshBarbadosBelarusBelgiumBelizeBeninBhutanBoliviaBosnia and HerzegovinaBotswanaBrazilBrunei DarussalamBulgariaBurkina FasoBurundiCabo VerdeCambodiaCameroonCanadaCaribbean small statesCentral African RepublicCentral Europe and the BalticsChadChileChinaColombiaComorosCongo, Dem. Rep.Congo, Rep.Costa RicaCote d'IvoireCroatiaCuracaoCyprusCzech RepublicDenmarkDjiboutiDominicaDominican RepublicEarly-demographic dividendEast Asia & PacificEast Asia & Pacific (excluding high income)East Asia & Pacific (IDA & IBRD countries)EcuadorEgypt, Arab Rep.El SalvadorEquatorial GuineaEritreaEstoniaEthiopiaEuro areaEurope & Central AsiaEurope & Central Asia (excluding high income)Europe & Central Asia (IDA & IBRD countries)European UnionFijiFinlandFragile and conflict affected situationsFranceGabonGambia, TheGeorgiaGermanyGhanaGreeceGrenadaGuatemalaGuineaGuinea-BissauGuyanaHaitiHeavily indebted poor countries (HIPC)High incomeHondurasHong Kong SAR, ChinaHungaryIBRD onlyIcelandIDA & IBRD totalIDA blendIDA onlyIDA totalIndiaIndonesiaIran, Islamic Rep.IraqIrelandIsraelItalyJamaicaJapanJordanKazakhstanKenyaKorea, Rep.KosovoKuwaitKyrgyz RepublicLao PDRLate-demographic dividendLatin America & Caribbean Latin America & Caribbean (excluding high income)Latin America & the Caribbean (IDA & IBRD countries)LatviaLeast developed countries: UN classificationLebanonLesothoLiberiaLibyaLithuaniaLow & middle incomeLow incomeLower middle incomeLuxembourgMacao SAR, ChinaMacedonia, FYRMadagascarMalawiMalaysiaMaldivesMaliMaltaMauritaniaMauritiusMexicoMicronesia, Fed. Sts.Middle East & North AfricaMiddle East & North Africa (excluding high income)Middle East & North Africa (IDA & IBRD countries)Middle incomeMoldovaMongoliaMontenegroMoroccoMozambiqueMyanmarNamibiaNepalNetherlandsNicaraguaNigerNigeriaNorth AmericaNorwayOECD membersOmanOther small statesPacific island small statesPakistanPanamaPapua New GuineaParaguayPeruPhilippinesPolandPortugalPost-demographic dividendPre-demographic dividendQatarRomaniaRussian FederationRwandaSamoaSao Tome and PrincipeSaudi ArabiaSenegalSerbiaSeychellesSierra LeoneSingaporeSlovak RepublicSloveniaSmall statesSolomon IslandsSouth AfricaSouth AsiaSouth Asia (IDA & IBRD)South SudanSpainSri LankaSt. Kitts and NevisSt. LuciaSt. Vincent and the GrenadinesSub-Saharan Africa Sub-Saharan Africa (excluding high income)Sub-Saharan Africa (IDA & IBRD countries)SudanSurinameSwazilandSwedenSwitzerlandSyrian Arab RepublicTajikistanTanzaniaThailandTimor-LesteTogoTongaTrinidad and TobagoTunisiaTurkeyUgandaUkraineUnited KingdomUnited StatesUpper middle incomeUruguayVanuatuVenezuela, RBVietnamWest Bank and GazaWorldYemen, Rep.ZambiaZimbabwe Linha do tempo:
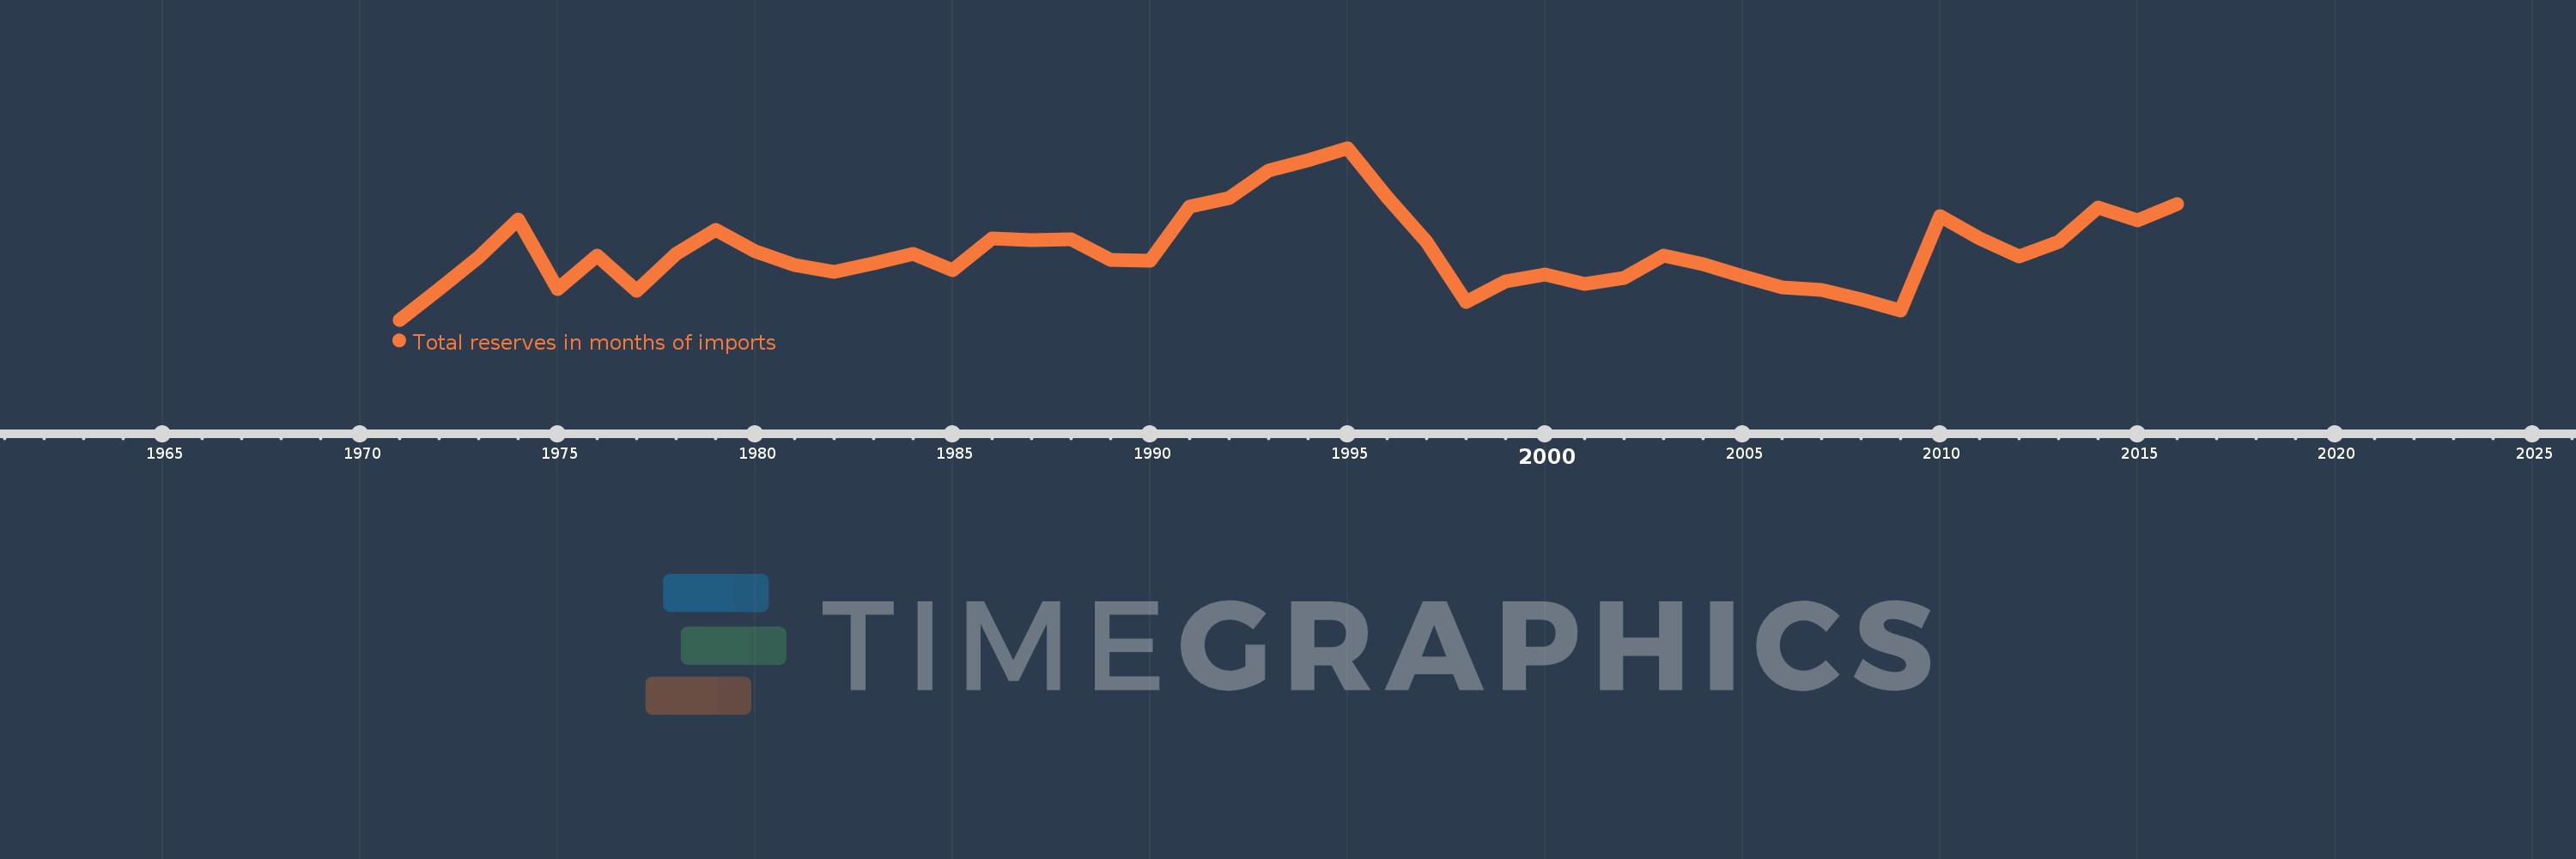
Nesta escala de tempo está apresentado um gráfico de 1971 ano até 2016 ano Sweden. Dados de 1970 ano ausente. O número de observações reais por data: 46.
Fonte (nome):
Indicadores de desenvolvimento mundial
Fonte (organização):
International Monetary Fund, International Financial Statistics and data files.
Categorias:
Financial Sector, External Debt
Foi atualizado:
23 abr 2017 ano
Indicadores de alterações dos valores ao longo dos anos
Mínimo:
1.111
1 jan 1971 ano
Máximo:
3.806
1 jan 1995 ano
Na data de observação
Valor
Mudança absoluta
A alteração em relação ao valor anterior
1 jan 1971 ano
1.111
+1.111
0.0%
1 jan 1972 ano
1.593
+0.482
43.4%
1 jan 1973 ano
2.091
+0.497
31.22%
1 jan 1974 ano
2.688
+0.597
28.55%
1 jan 1975 ano
1.598
-1.09
-40.55%
1 jan 1976 ano
2.113
+0.516
32.26%
1 jan 1977 ano
1.563
-0.55
-26.04%
1 jan 1978 ano
2.138
+0.575
36.8%
1 jan 1979 ano
2.517
+0.379
17.71%
1 jan 1980 ano
2.189
-0.328
-13.04%
1 jan 1981 ano
1.976
-0.213
-9.75%
1 jan 1982 ano
1.856
-0.12
-6.05%
1 jan 1983 ano
1.992
+0.136
7.32%
1 jan 1984 ano
2.147
+0.155
7.78%
1 jan 1985 ano
1.893
-0.254
-11.82%
1 jan 1986 ano
2.391
+0.498
26.33%
1 jan 1987 ano
2.355
-0.036
-1.51%
1 jan 1988 ano
2.378
+0.023
0.97%
1 jan 1989 ano
2.052
-0.326
-13.72%
1 jan 1990 ano
2.034
-0.018
-0.86%
1 jan 1991 ano
2.882
+0.848
41.67%
1 jan 1992 ano
3.02
+0.138
4.78%
1 jan 1993 ano
3.45
+0.43
14.23%
1 jan 1994 ano
3.607
+0.157
4.56%
1 jan 1995 ano
3.806
+0.199
5.52%
1 jan 1996 ano
3.036
-0.77
-20.23%
1 jan 1997 ano
2.334
-0.702
-23.13%
1 jan 1998 ano
1.394
-0.939
-40.25%
1 jan 1999 ano
1.712
+0.318
22.78%
1 jan 2000 ano
1.827
+0.115
6.73%
1 jan 2001 ano
1.669
-0.158
-8.64%
1 jan 2002 ano
1.763
+0.093
5.59%
1 jan 2003 ano
2.114
+0.352
19.95%
1 jan 2004 ano
1.986
-0.129
-6.1%
1 jan 2005 ano
1.798
-0.187
-9.43%
1 jan 2006 ano
1.613
-0.185
-10.31%
1 jan 2007 ano
1.581
-0.032
-1.98%
1 jan 2008 ano
1.437
-0.144
-9.09%
1 jan 2009 ano
1.259
-0.178
-12.4%
1 jan 2010 ano
2.744
+1.485
117.95%
1 jan 2011 ano
2.388
-0.356
-12.97%
1 jan 2012 ano
2.11
-0.278
-11.65%
1 jan 2013 ano
2.327
+0.217
10.3%
1 jan 2014 ano
2.872
+0.545
23.4%
1 jan 2015 ano
2.674
-0.199
-6.91%
1 jan 2016 ano
2.921
+0.248
9.27%
Classificação de países por estatísticas atuais por anos


Comentários: