29
/pt/
pt
AIzaSyAYiBZKx7MnpbEhh9jyipgxe19OcubqV5w
April 1, 2024
202395
Morocco
MAR
true
2
1
Total reserves in months of imports
2016,2015,2014,2013,2012,2011,2010,2009,2008,2007,2006,2005,2004,2003,2002,2001,2000,1999,1998,1997,1996,1995,1994,1993,1992,1991,1990,1989,1988,1987,1986,1985,1984,1983,1982,1981,1980,1979,1978,1977,1976
Estas estatísticas em outros países:
AfghanistanAlbaniaAlgeriaAngolaAntigua and BarbudaArab WorldArgentinaArmeniaArubaAustraliaAustriaAzerbaijanBahamas, TheBahrainBangladeshBarbadosBelarusBelgiumBelizeBeninBhutanBoliviaBosnia and HerzegovinaBotswanaBrazilBrunei DarussalamBulgariaBurkina FasoBurundiCabo VerdeCambodiaCameroonCanadaCaribbean small statesCentral African RepublicCentral Europe and the BalticsChadChileChinaColombiaComorosCongo, Dem. Rep.Congo, Rep.Costa RicaCote d'IvoireCroatiaCuracaoCyprusCzech RepublicDenmarkDjiboutiDominicaDominican RepublicEarly-demographic dividendEast Asia & PacificEast Asia & Pacific (excluding high income)East Asia & Pacific (IDA & IBRD countries)EcuadorEgypt, Arab Rep.El SalvadorEquatorial GuineaEritreaEstoniaEthiopiaEuro areaEurope & Central AsiaEurope & Central Asia (excluding high income)Europe & Central Asia (IDA & IBRD countries)European UnionFijiFinlandFragile and conflict affected situationsFranceGabonGambia, TheGeorgiaGermanyGhanaGreeceGrenadaGuatemalaGuineaGuinea-BissauGuyanaHaitiHeavily indebted poor countries (HIPC)High incomeHondurasHong Kong SAR, ChinaHungaryIBRD onlyIcelandIDA & IBRD totalIDA blendIDA onlyIDA totalIndiaIndonesiaIran, Islamic Rep.IraqIrelandIsraelItalyJamaicaJapanJordanKazakhstanKenyaKorea, Rep.KosovoKuwaitKyrgyz RepublicLao PDRLate-demographic dividendLatin America & Caribbean Latin America & Caribbean (excluding high income)Latin America & the Caribbean (IDA & IBRD countries)LatviaLeast developed countries: UN classificationLebanonLesothoLiberiaLibyaLithuaniaLow & middle incomeLow incomeLower middle incomeLuxembourgMacao SAR, ChinaMacedonia, FYRMadagascarMalawiMalaysiaMaldivesMaliMaltaMauritaniaMauritiusMexicoMicronesia, Fed. Sts.Middle East & North AfricaMiddle East & North Africa (excluding high income)Middle East & North Africa (IDA & IBRD countries)Middle incomeMoldovaMongoliaMontenegroMoroccoMozambiqueMyanmarNamibiaNepalNetherlandsNicaraguaNigerNigeriaNorth AmericaNorwayOECD membersOmanOther small statesPacific island small statesPakistanPanamaPapua New GuineaParaguayPeruPhilippinesPolandPortugalPost-demographic dividendPre-demographic dividendQatarRomaniaRussian FederationRwandaSamoaSao Tome and PrincipeSaudi ArabiaSenegalSerbiaSeychellesSierra LeoneSingaporeSlovak RepublicSloveniaSmall statesSolomon IslandsSouth AfricaSouth AsiaSouth Asia (IDA & IBRD)South SudanSpainSri LankaSt. Kitts and NevisSt. LuciaSt. Vincent and the GrenadinesSub-Saharan Africa Sub-Saharan Africa (excluding high income)Sub-Saharan Africa (IDA & IBRD countries)SudanSurinameSwazilandSwedenSwitzerlandSyrian Arab RepublicTajikistanTanzaniaThailandTimor-LesteTogoTongaTrinidad and TobagoTunisiaTurkeyUgandaUkraineUnited KingdomUnited StatesUpper middle incomeUruguayVanuatuVenezuela, RBVietnamWest Bank and GazaWorldYemen, Rep.ZambiaZimbabwe Linha do tempo:
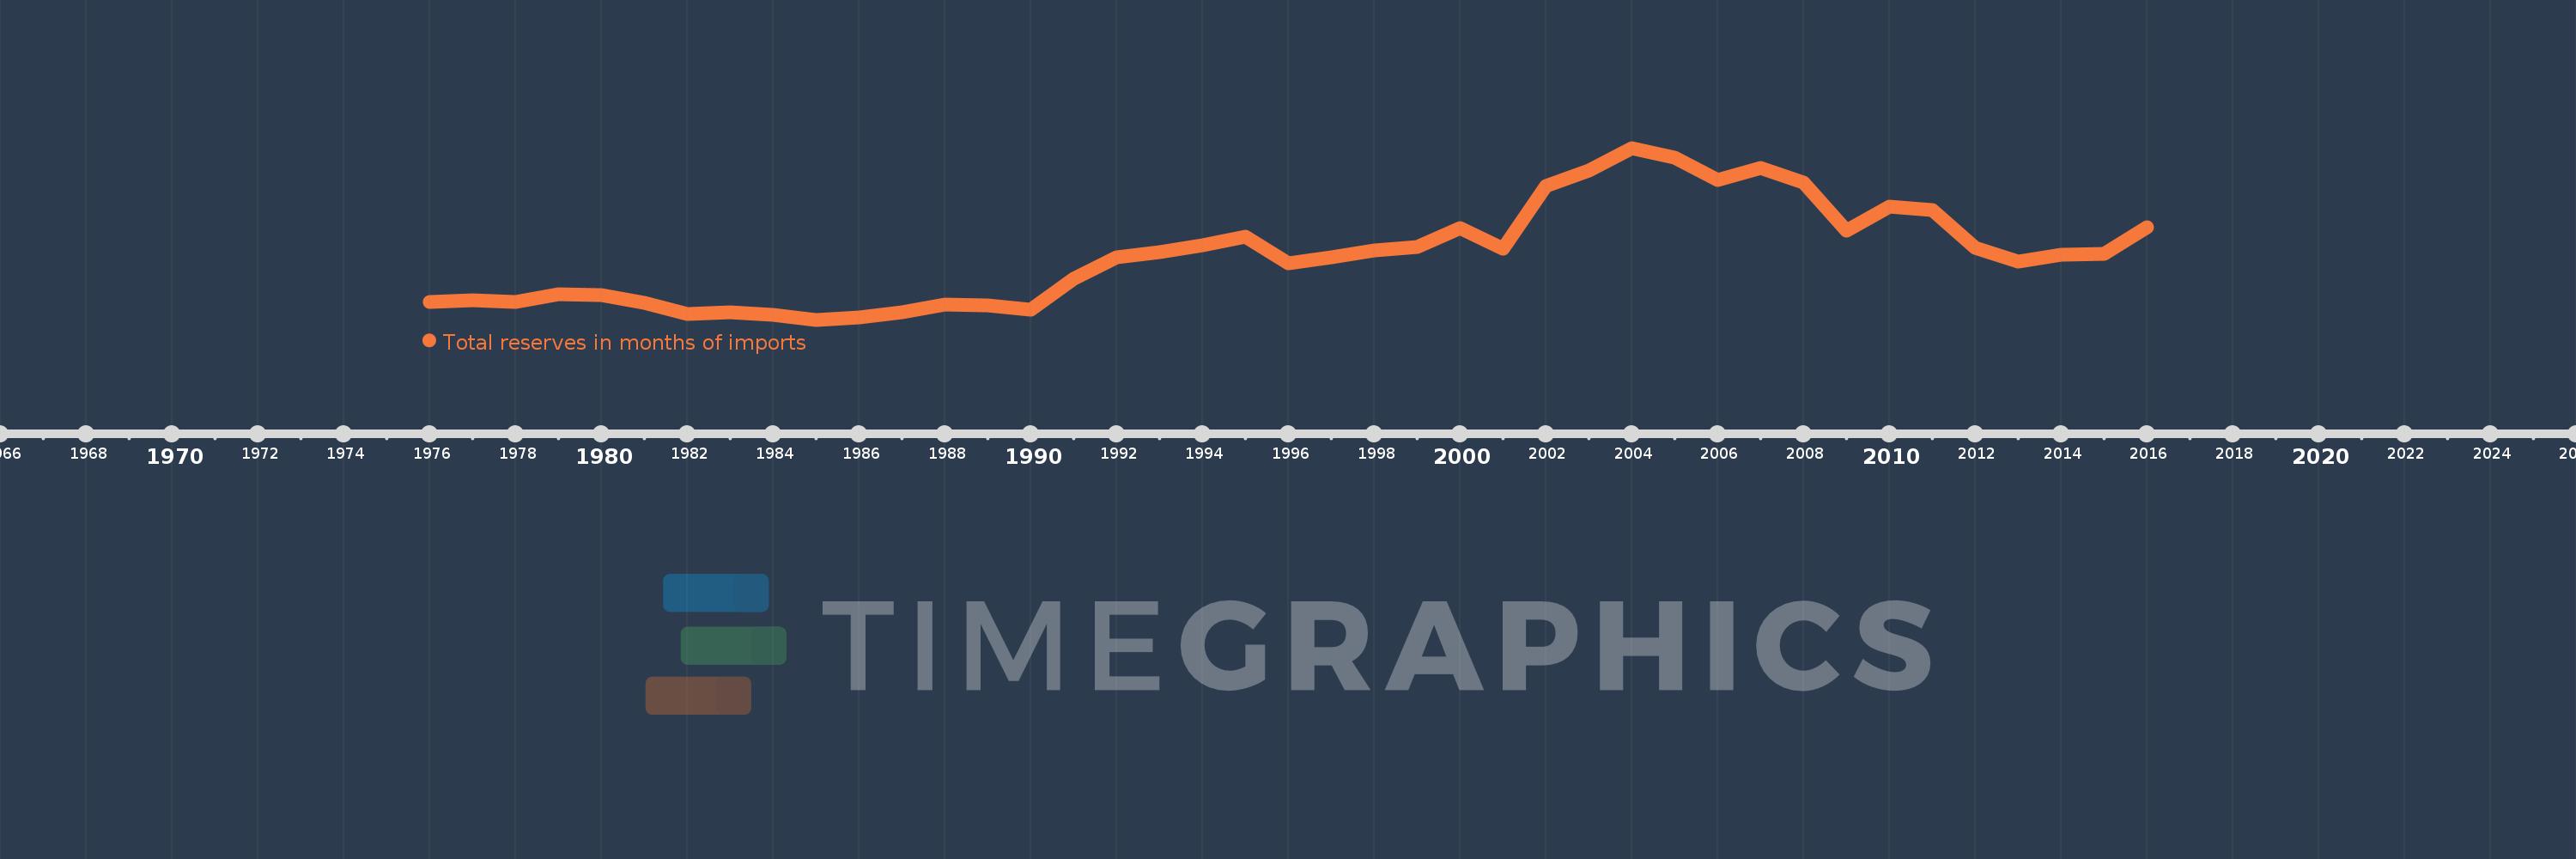
Nesta escala de tempo está apresentado um gráfico de 1976 ano até 2016 ano Morocco. Dados de 1975 ano ausente. O número de observações reais por data: 41.
Fonte (nome):
Indicadores de desenvolvimento mundial
Fonte (organização):
International Monetary Fund, International Financial Statistics and data files.
Categorias:
Financial Sector, External Debt
Foi atualizado:
23 abr 2017 ano
Indicadores de alterações dos valores ao longo dos anos
Mínimo:
0.645
1 jan 1985 ano
Máximo:
11.15
1 jan 2004 ano
Na data de observação
Valor
Mudança absoluta
A alteração em relação ao valor anterior
1 jan 1976 ano
1.719
+1.719
0.0%
1 jan 1977 ano
1.829
+0.111
6.43%
1 jan 1978 ano
1.715
-0.114
-6.23%
1 jan 1979 ano
2.182
+0.466
27.2%
1 jan 1980 ano
2.132
-0.05
-2.28%
1 jan 1981 ano
1.681
-0.451
-21.14%
1 jan 1982 ano
1.017
-0.665
-39.53%
1 jan 1983 ano
1.111
+0.094
9.28%
1 jan 1984 ano
0.936
-0.175
-15.71%
1 jan 1985 ano
0.645
-0.291
-31.11%
1 jan 1986 ano
0.808
+0.163
25.32%
1 jan 1987 ano
1.093
+0.285
35.22%
1 jan 1988 ano
1.559
+0.466
42.61%
1 jan 1989 ano
1.533
-0.026
-1.65%
1 jan 1990 ano
1.246
-0.287
-18.73%
1 jan 1991 ano
3.168
+1.922
154.27%
1 jan 1992 ano
4.463
+1.295
40.86%
1 jan 1993 ano
4.756
+0.293
6.56%
1 jan 1994 ano
5.178
+0.423
8.88%
1 jan 1995 ano
5.732
+0.554
10.69%
1 jan 1996 ano
4.101
-1.631
-28.45%
1 jan 1997 ano
4.46
+0.359
8.74%
1 jan 1998 ano
4.877
+0.417
9.35%
1 jan 1999 ano
5.077
+0.2
4.1%
1 jan 2000 ano
6.245
+1.168
23.01%
1 jan 2001 ano
4.982
-1.263
-20.23%
1 jan 2002 ano
8.803
+3.821
76.7%
1 jan 2003 ano
9.763
+0.96
10.9%
1 jan 2004 ano
11.15
+1.387
14.21%
1 jan 2005 ano
10.568
-0.582
-5.22%
1 jan 2006 ano
9.188
-1.38
-13.06%
1 jan 2007 ano
9.947
+0.758
8.25%
1 jan 2008 ano
9.059
-0.887
-8.92%
1 jan 2009 ano
6.071
-2.989
-32.99%
1 jan 2010 ano
7.573
+1.502
24.74%
1 jan 2011 ano
7.351
-0.222
-2.94%
1 jan 2012 ano
5.025
-2.326
-31.64%
1 jan 2013 ano
4.181
-0.844
-16.79%
1 jan 2014 ano
4.603
+0.422
10.09%
1 jan 2015 ano
4.673
+0.07
1.53%
1 jan 2016 ano
6.328
+1.655
35.41%
Classificação de países por estatísticas atuais por anos


Comentários: