29
/pt/
pt
AIzaSyAYiBZKx7MnpbEhh9jyipgxe19OcubqV5w
April 1, 2024
172293
Kuwait
KWT
true
2
1
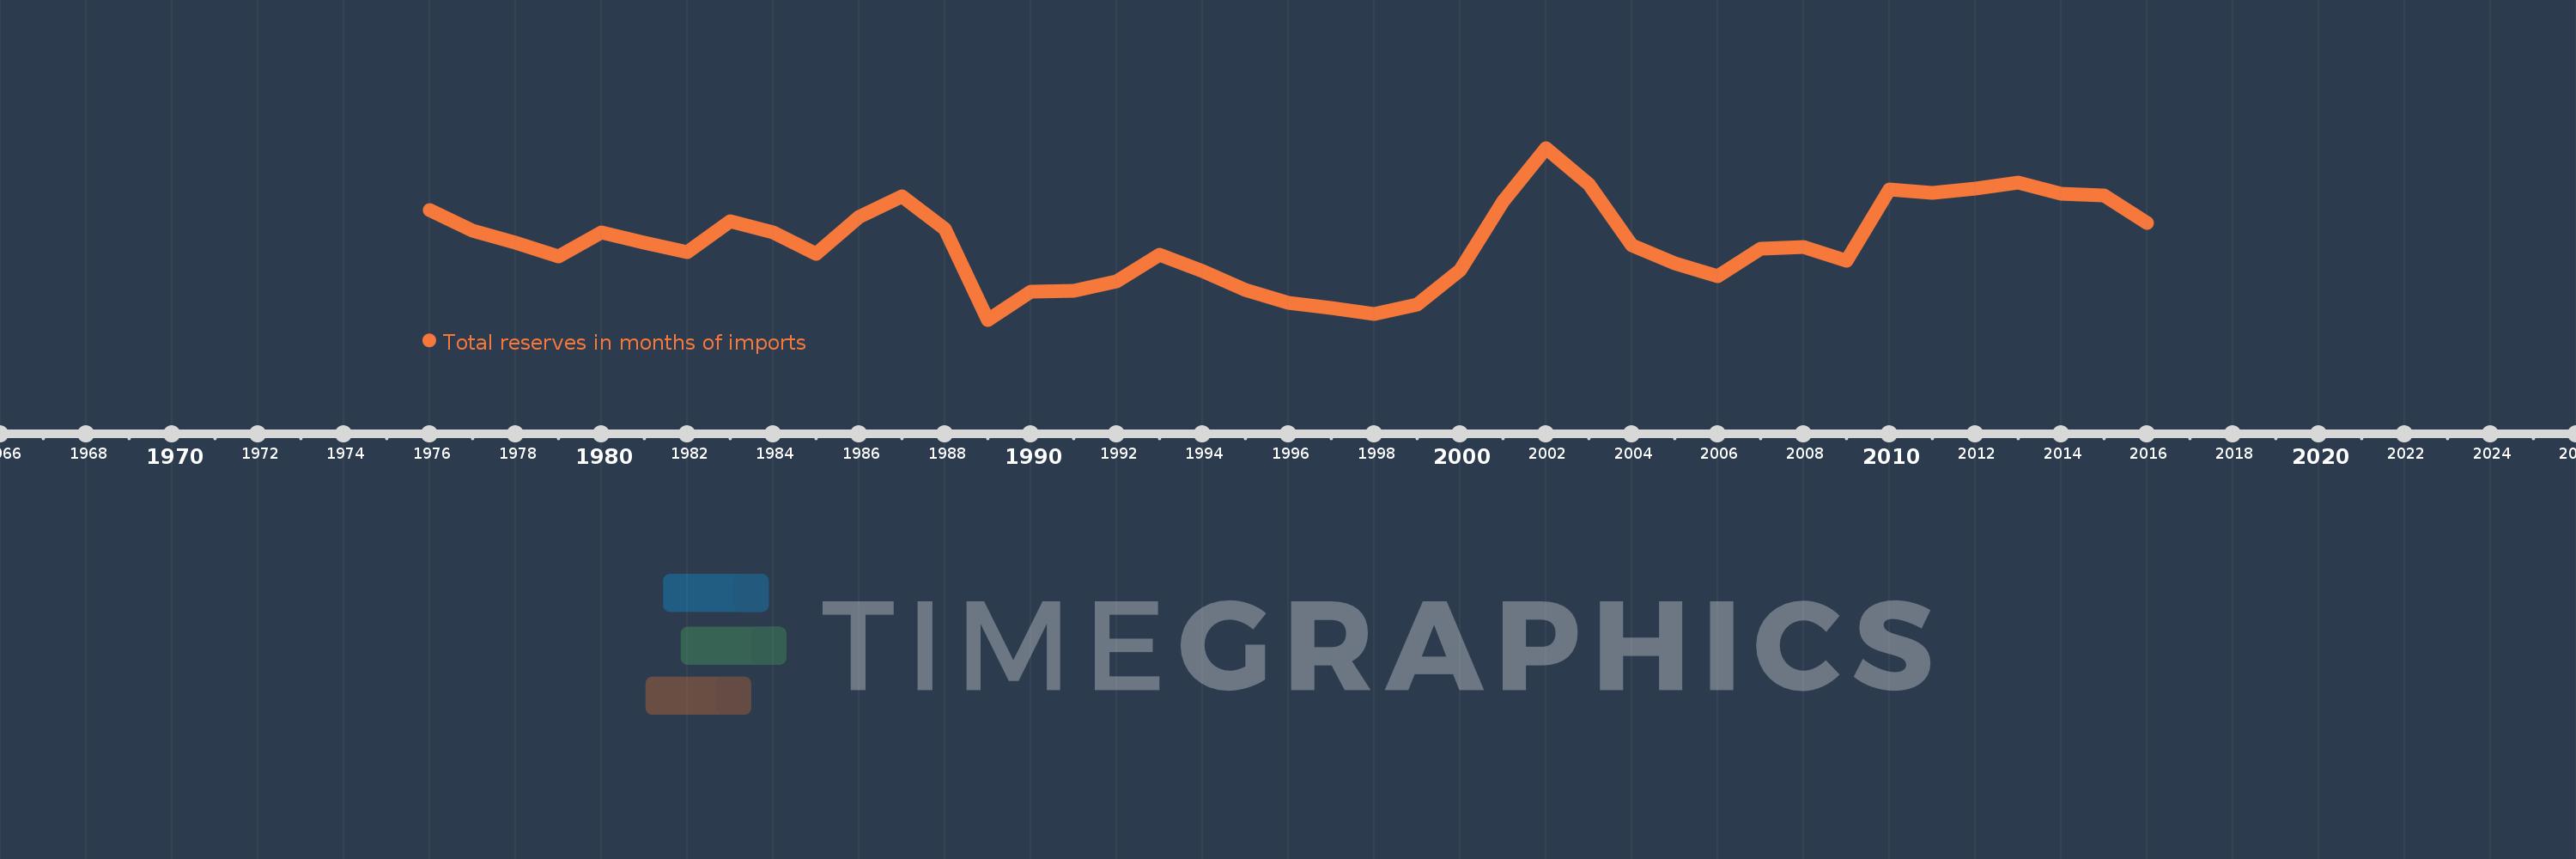
Total reserves in months of imports
2016,2015,2014,2013,2012,2011,2010,2009,2008,2007,2006,2005,2004,2003,2002,2001,2000,1999,1998,1997,1996,1995,1994,1993,1992,1991,1990,1989,1988,1987,1986,1985,1984,1983,1982,1981,1980,1979,1978,1977,1976
Estas estatísticas em outros países:
AfghanistanAlbaniaAlgeriaAngolaAntigua and BarbudaArab WorldArgentinaArmeniaArubaAustraliaAustriaAzerbaijanBahamas, TheBahrainBangladeshBarbadosBelarusBelgiumBelizeBeninBhutanBoliviaBosnia and HerzegovinaBotswanaBrazilBrunei DarussalamBulgariaBurkina FasoBurundiCabo VerdeCambodiaCameroonCanadaCaribbean small statesCentral African RepublicCentral Europe and the BalticsChadChileChinaColombiaComorosCongo, Dem. Rep.Congo, Rep.Costa RicaCote d'IvoireCroatiaCuracaoCyprusCzech RepublicDenmarkDjiboutiDominicaDominican RepublicEarly-demographic dividendEast Asia & PacificEast Asia & Pacific (excluding high income)East Asia & Pacific (IDA & IBRD countries)EcuadorEgypt, Arab Rep.El SalvadorEquatorial GuineaEritreaEstoniaEthiopiaEuro areaEurope & Central AsiaEurope & Central Asia (excluding high income)Europe & Central Asia (IDA & IBRD countries)European UnionFijiFinlandFragile and conflict affected situationsFranceGabonGambia, TheGeorgiaGermanyGhanaGreeceGrenadaGuatemalaGuineaGuinea-BissauGuyanaHaitiHeavily indebted poor countries (HIPC)High incomeHondurasHong Kong SAR, ChinaHungaryIBRD onlyIcelandIDA & IBRD totalIDA blendIDA onlyIDA totalIndiaIndonesiaIran, Islamic Rep.IraqIrelandIsraelItalyJamaicaJapanJordanKazakhstanKenyaKorea, Rep.KosovoKuwaitKyrgyz RepublicLao PDRLate-demographic dividendLatin America & Caribbean Latin America & Caribbean (excluding high income)Latin America & the Caribbean (IDA & IBRD countries)LatviaLeast developed countries: UN classificationLebanonLesothoLiberiaLibyaLithuaniaLow & middle incomeLow incomeLower middle incomeLuxembourgMacao SAR, ChinaMacedonia, FYRMadagascarMalawiMalaysiaMaldivesMaliMaltaMauritaniaMauritiusMexicoMicronesia, Fed. Sts.Middle East & North AfricaMiddle East & North Africa (excluding high income)Middle East & North Africa (IDA & IBRD countries)Middle incomeMoldovaMongoliaMontenegroMoroccoMozambiqueMyanmarNamibiaNepalNetherlandsNicaraguaNigerNigeriaNorth AmericaNorwayOECD membersOmanOther small statesPacific island small statesPakistanPanamaPapua New GuineaParaguayPeruPhilippinesPolandPortugalPost-demographic dividendPre-demographic dividendQatarRomaniaRussian FederationRwandaSamoaSao Tome and PrincipeSaudi ArabiaSenegalSerbiaSeychellesSierra LeoneSingaporeSlovak RepublicSloveniaSmall statesSolomon IslandsSouth AfricaSouth AsiaSouth Asia (IDA & IBRD)South SudanSpainSri LankaSt. Kitts and NevisSt. LuciaSt. Vincent and the GrenadinesSub-Saharan Africa Sub-Saharan Africa (excluding high income)Sub-Saharan Africa (IDA & IBRD countries)SudanSurinameSwazilandSwedenSwitzerlandSyrian Arab RepublicTajikistanTanzaniaThailandTimor-LesteTogoTongaTrinidad and TobagoTunisiaTurkeyUgandaUkraineUnited KingdomUnited StatesUpper middle incomeUruguayVanuatuVenezuela, RBVietnamWest Bank and GazaWorldYemen, Rep.ZambiaZimbabwe Linha do tempo:
Nesta escala de tempo está apresentado um gráfico de 1976 ano até 2016 ano Kuwait. Dados de 1975 ano ausente. O número de observações reais por data: 41.
Fonte (nome):
Indicadores de desenvolvimento mundial
Fonte (organização):
International Monetary Fund, International Financial Statistics and data files.
Categorias:
Financial Sector, External Debt
Foi atualizado:
23 abr 2017 ano
Indicadores de alterações dos valores ao longo dos anos
Mínimo:
3.292
1 jan 1989 ano
Máximo:
9.84
1 jan 2002 ano
Na data de observação
Valor
Mudança absoluta
A alteração em relação ao valor anterior
1 jan 1976 ano
7.482
+7.482
0.0%
1 jan 1977 ano
6.694
-0.788
-10.53%
1 jan 1978 ano
6.24
-0.453
-6.77%
1 jan 1979 ano
5.691
-0.549
-8.8%
1 jan 1980 ano
6.626
+0.935
16.43%
1 jan 1981 ano
6.222
-0.404
-6.1%
1 jan 1982 ano
5.869
-0.354
-5.69%
1 jan 1983 ano
7.041
+1.172
19.97%
1 jan 1984 ano
6.606
-0.435
-6.17%
1 jan 1985 ano
5.813
-0.793
-12.01%
1 jan 1986 ano
7.221
+1.409
24.24%
1 jan 1987 ano
8.001
+0.78
10.8%
1 jan 1988 ano
6.742
-1.26
-15.75%
1 jan 1989 ano
3.292
-3.45
-51.17%
1 jan 1990 ano
4.367
+1.075
32.66%
1 jan 1991 ano
4.386
+0.019
0.43%
1 jan 1992 ano
4.765
+0.38
8.66%
1 jan 1993 ano
5.758
+0.993
20.84%
1 jan 1994 ano
5.145
-0.613
-10.65%
1 jan 1995 ano
4.435
-0.71
-13.8%
1 jan 1996 ano
3.933
-0.502
-11.32%
1 jan 1997 ano
3.749
-0.184
-4.68%
1 jan 1998 ano
3.504
-0.245
-6.54%
1 jan 1999 ano
3.856
+0.352
10.04%
1 jan 2000 ano
5.187
+1.33
34.5%
1 jan 2001 ano
7.787
+2.6
50.13%
1 jan 2002 ano
9.84
+2.054
26.37%
1 jan 2003 ano
8.443
-1.397
-14.2%
1 jan 2004 ano
6.144
-2.299
-27.23%
1 jan 2005 ano
5.449
-0.695
-11.31%
1 jan 2006 ano
4.957
-0.493
-9.04%
1 jan 2007 ano
5.989
+1.032
20.83%
1 jan 2008 ano
6.051
+0.062
1.03%
1 jan 2009 ano
5.529
-0.522
-8.63%
1 jan 2010 ano
8.261
+2.733
49.43%
1 jan 2011 ano
8.128
-0.133
-1.61%
1 jan 2012 ano
8.277
+0.149
1.83%
1 jan 2013 ano
8.518
+0.242
2.92%
1 jan 2014 ano
8.107
-0.412
-4.83%
1 jan 2015 ano
8.03
-0.077
-0.95%
1 jan 2016 ano
6.973
-1.057
-13.16%
Classificação de países por estatísticas atuais por anos


Comentários: