29
/pt/
pt
AIzaSyAYiBZKx7MnpbEhh9jyipgxe19OcubqV5w
April 1, 2024
249703
St. Kitts and Nevis
KNA
true
2
1
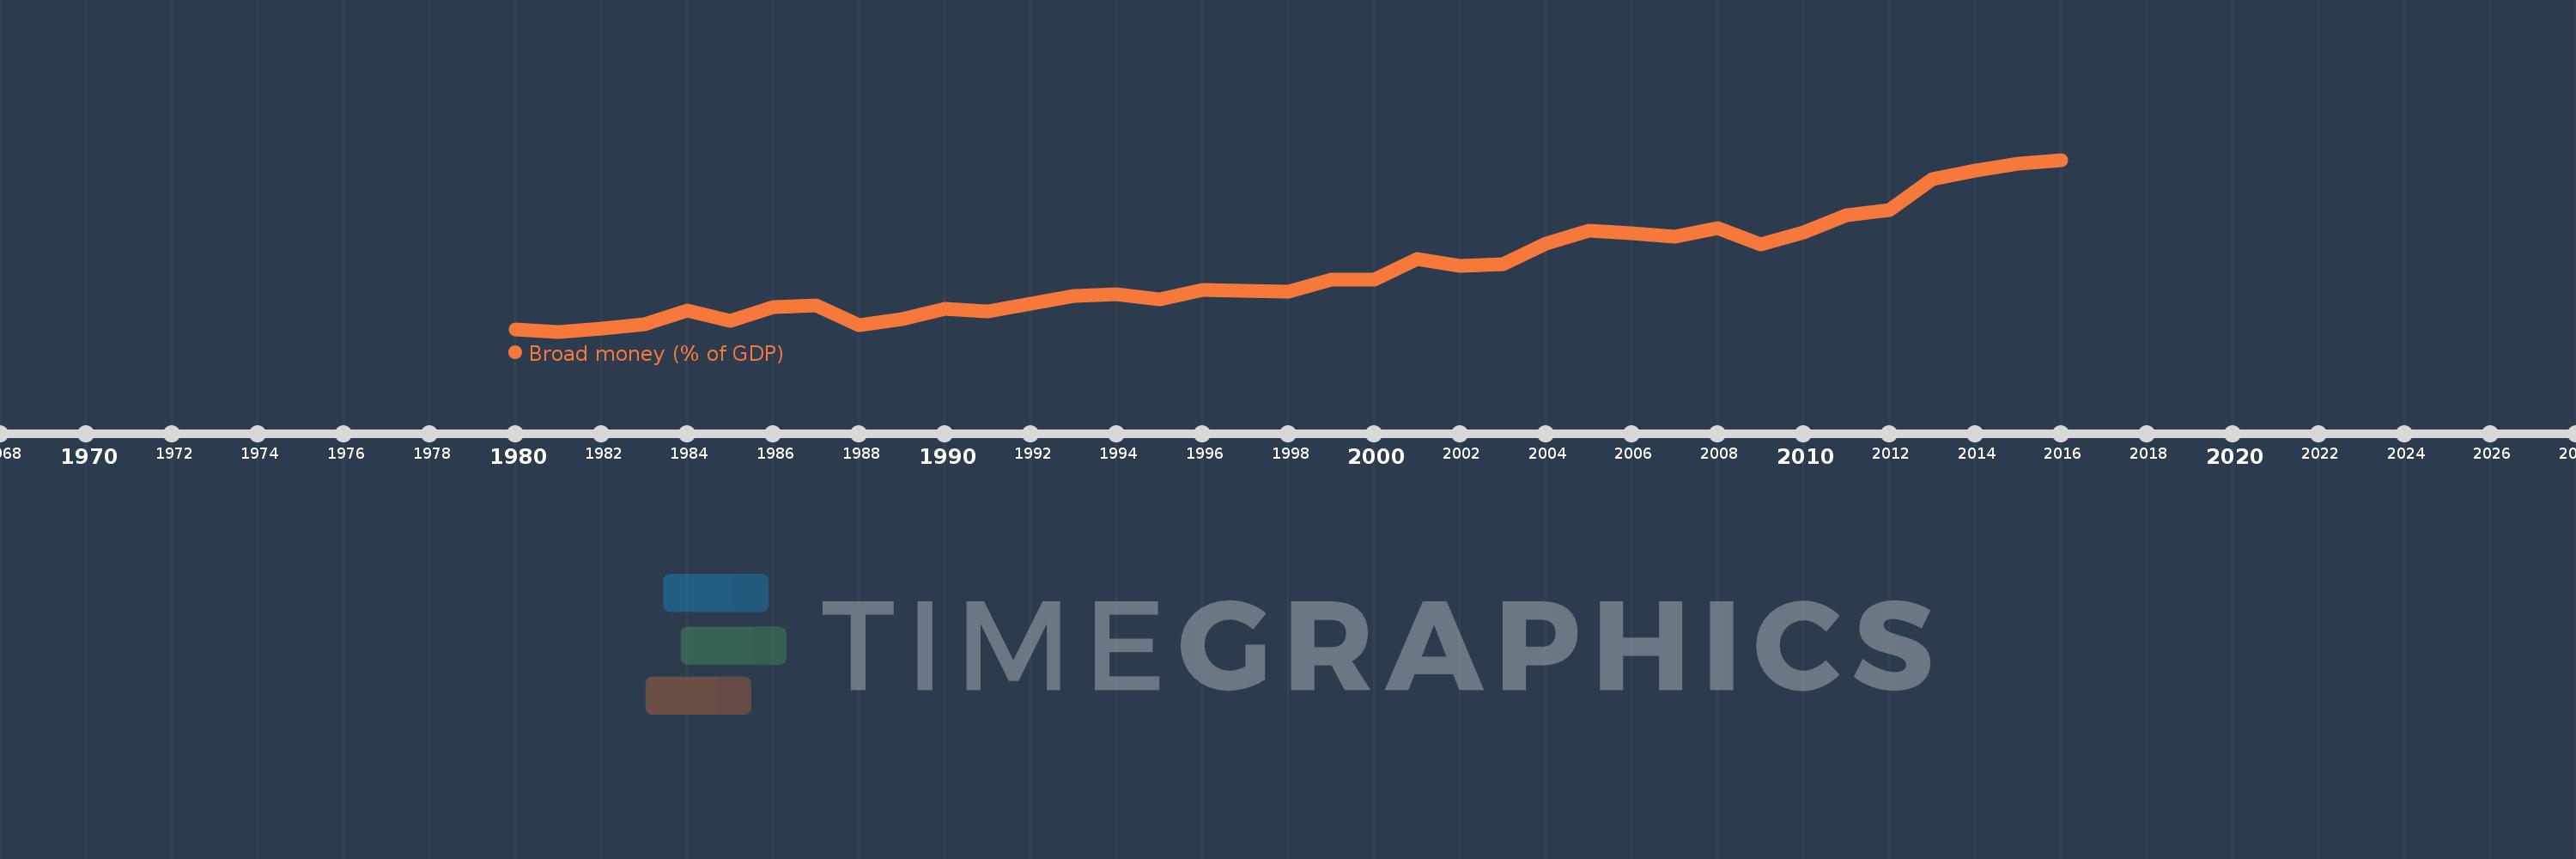
Broad money (% of GDP)
2016,2015,2014,2013,2012,2011,2010,2009,2008,2007,2006,2005,2004,2003,2002,2001,2000,1999,1998,1997,1996,1995,1994,1993,1992,1991,1990,1989,1988,1987,1986,1985,1984,1983,1982,1981,1980
Estas estatísticas em outros países:
AfghanistanAlbaniaAlgeriaAngolaAntigua and BarbudaArab WorldArgentinaArmeniaArubaAustraliaAzerbaijanBahamas, TheBahrainBangladeshBarbadosBelarusBelizeBeninBhutanBoliviaBosnia and HerzegovinaBotswanaBrazilBrunei DarussalamBulgariaBurkina FasoBurundiCabo VerdeCambodiaCameroonCanadaCaribbean small statesCentral African RepublicCentral Europe and the BalticsChadChileChinaColombiaComorosCongo, Dem. Rep.Congo, Rep.Costa RicaCote d'IvoireCroatiaCzech RepublicDenmarkDjiboutiDominicaDominican RepublicEarly-demographic dividendEast Asia & PacificEast Asia & Pacific (excluding high income)East Asia & Pacific (IDA & IBRD countries)EcuadorEgypt, Arab Rep.El SalvadorEquatorial GuineaEritreaEstoniaEthiopiaEurope & Central Asia (excluding high income)Europe & Central Asia (IDA & IBRD countries)FijiFragile and conflict affected situationsGabonGambia, TheGeorgiaGhanaGrenadaGuatemalaGuineaGuinea-BissauGuyanaHaitiHeavily indebted poor countries (HIPC)High incomeHondurasHong Kong SAR, ChinaHungaryIBRD onlyIcelandIDA & IBRD totalIDA blendIDA onlyIDA totalIndiaIndonesiaIran, Islamic Rep.IraqIsraelJamaicaJapanJordanKazakhstanKenyaKorea, Rep.KuwaitKyrgyz RepublicLao PDRLate-demographic dividendLatin America & Caribbean Latin America & Caribbean (excluding high income)Latin America & the Caribbean (IDA & IBRD countries)LatviaLeast developed countries: UN classificationLebanonLesothoLiberiaLibyaLithuaniaLow & middle incomeLow incomeLower middle incomeMacao SAR, ChinaMacedonia, FYRMadagascarMalawiMalaysiaMaldivesMaliMauritaniaMauritiusMexicoMicronesia, Fed. Sts.Middle East & North AfricaMiddle East & North Africa (excluding high income)Middle East & North Africa (IDA & IBRD countries)Middle incomeMoldovaMongoliaMoroccoMozambiqueMyanmarNamibiaNepalNew ZealandNicaraguaNigerNigeriaNorth AmericaNorwayOECD membersOmanOther small statesPacific island small statesPakistanPanamaPapua New GuineaParaguayPeruPhilippinesPolandPost-demographic dividendPre-demographic dividendQatarRomaniaRussian FederationRwandaSamoaSao Tome and PrincipeSaudi ArabiaSenegalSerbiaSeychellesSierra LeoneSingaporeSlovak RepublicSmall statesSolomon IslandsSouth AfricaSouth AsiaSouth Asia (IDA & IBRD)South SudanSri LankaSt. Kitts and NevisSt. LuciaSt. Vincent and the GrenadinesSub-Saharan Africa Sub-Saharan Africa (excluding high income)Sub-Saharan Africa (IDA & IBRD countries)SudanSurinameSwazilandSwedenSwitzerlandSyrian Arab RepublicTajikistanTanzaniaThailandTimor-LesteTogoTongaTrinidad and TobagoTunisiaTurkeyUgandaUkraineUnited Arab EmiratesUnited KingdomUnited StatesUpper middle incomeUruguayVanuatuVenezuela, RBVietnamWest Bank and GazaWorldYemen, Rep.ZambiaZimbabwe Linha do tempo:
Nesta escala de tempo está apresentado um gráfico de 1980 ano até 2016 ano St. Kitts and Nevis. Dados de 1979 ano ausente. O número de observações reais por data: 37.
Fonte (nome):
Indicadores de desenvolvimento mundial
Fonte (organização):
International Monetary Fund, International Financial Statistics and data files, and World Bank and OECD GDP estimates.
Categorias:
Financial Sector
Foi atualizado:
23 abr 2017 ano
Indicadores de alterações dos valores ao longo dos anos
Mínimo:
52.858
1 jan 1981 ano
Máximo:
158.735
1 jan 2016 ano
Na data de observação
Valor
Mudança absoluta
A alteração em relação ao valor anterior
1 jan 1980 ano
54.34
+54.34
0.0%
1 jan 1981 ano
52.858
-1.482
-2.73%
1 jan 1982 ano
54.757
+1.899
3.59%
1 jan 1983 ano
57.463
+2.705
4.94%
1 jan 1984 ano
65.582
+8.12
14.13%
1 jan 1985 ano
59.363
-6.22
-9.48%
1 jan 1986 ano
67.778
+8.415
14.18%
1 jan 1987 ano
68.757
+0.979
1.44%
1 jan 1988 ano
56.975
-11.782
-17.14%
1 jan 1989 ano
60.608
+3.633
6.38%
1 jan 1990 ano
67.088
+6.48
10.69%
1 jan 1991 ano
65.511
-1.577
-2.35%
1 jan 1992 ano
69.969
+4.457
6.8%
1 jan 1993 ano
75.048
+5.079
7.26%
1 jan 1994 ano
76.134
+1.086
1.45%
1 jan 1995 ano
72.928
-3.206
-4.21%
1 jan 1996 ano
78.771
+5.843
8.01%
1 jan 1997 ano
77.902
-0.869
-1.1%
1 jan 1998 ano
77.523
-0.38
-0.49%
1 jan 1999 ano
84.947
+7.424
9.58%
1 jan 2000 ano
84.649
-0.298
-0.35%
1 jan 2001 ano
97.521
+12.872
15.21%
1 jan 2002 ano
93.388
-4.134
-4.24%
1 jan 2003 ano
94.345
+0.958
1.03%
1 jan 2004 ano
107.226
+12.881
13.65%
1 jan 2005 ano
115.313
+8.087
7.54%
1 jan 2006 ano
113.648
-1.665
-1.44%
1 jan 2007 ano
111.133
-2.515
-2.21%
1 jan 2008 ano
116.609
+5.476
4.93%
1 jan 2009 ano
106.61
-9.999
-8.58%
1 jan 2010 ano
114.235
+7.625
7.15%
1 jan 2011 ano
124.7
+10.465
9.16%
1 jan 2012 ano
127.997
+3.297
2.64%
1 jan 2013 ano
146.984
+18.987
14.83%
1 jan 2014 ano
152.085
+5.101
3.47%
1 jan 2015 ano
156.508
+4.423
2.91%
1 jan 2016 ano
158.735
+2.227
1.42%
Classificação de países por estatísticas atuais por anos


Comentários: