29
/pt/
pt
AIzaSyAYiBZKx7MnpbEhh9jyipgxe19OcubqV5w
April 1, 2024
182761
Macao SAR, China
MAC
true
2
1
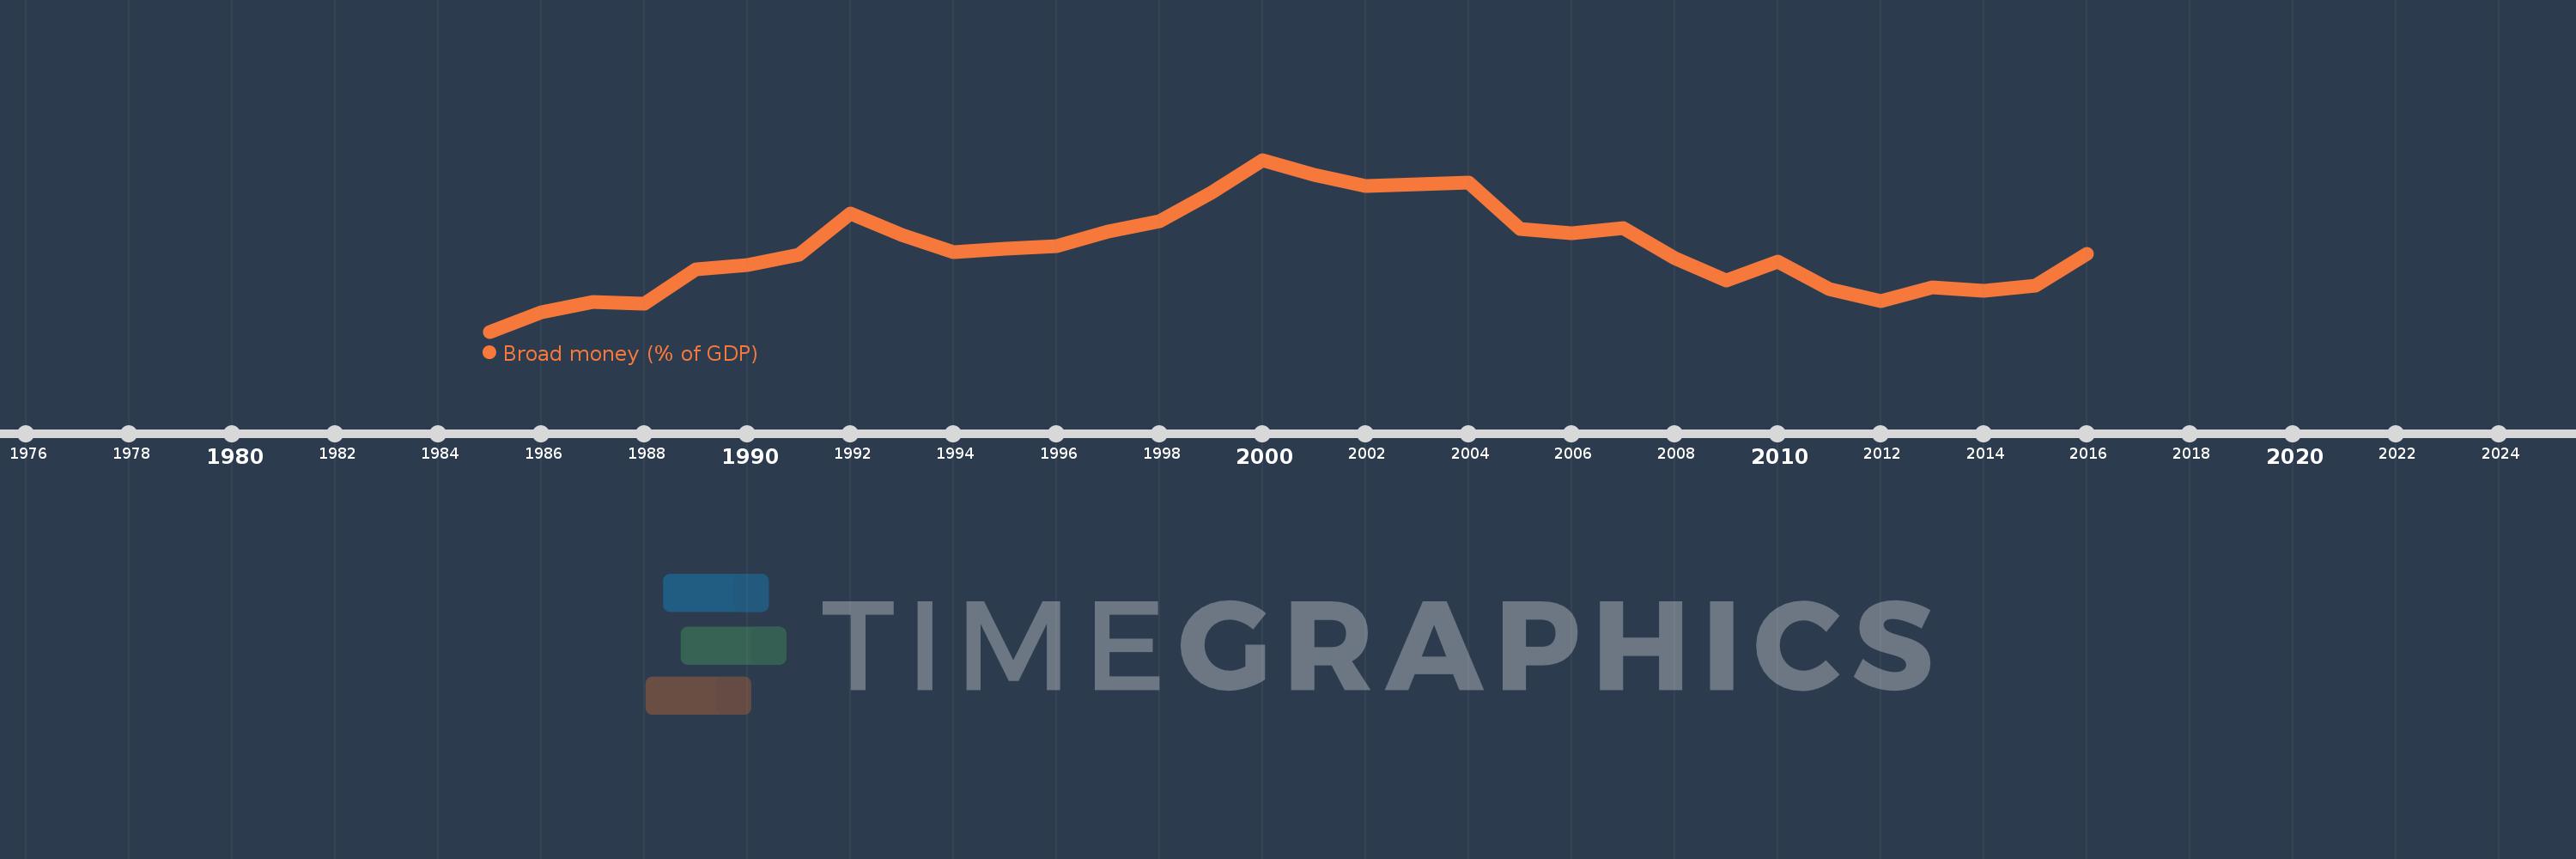
Broad money (% of GDP)
2016,2015,2014,2013,2012,2011,2010,2009,2008,2007,2006,2005,2004,2003,2002,2001,2000,1999,1998,1997,1996,1995,1994,1993,1992,1991,1990,1989,1988,1987,1986,1985
Estas estatísticas em outros países:
AfghanistanAlbaniaAlgeriaAngolaAntigua and BarbudaArab WorldArgentinaArmeniaArubaAustraliaAzerbaijanBahamas, TheBahrainBangladeshBarbadosBelarusBelizeBeninBhutanBoliviaBosnia and HerzegovinaBotswanaBrazilBrunei DarussalamBulgariaBurkina FasoBurundiCabo VerdeCambodiaCameroonCanadaCaribbean small statesCentral African RepublicCentral Europe and the BalticsChadChileChinaColombiaComorosCongo, Dem. Rep.Congo, Rep.Costa RicaCote d'IvoireCroatiaCzech RepublicDenmarkDjiboutiDominicaDominican RepublicEarly-demographic dividendEast Asia & PacificEast Asia & Pacific (excluding high income)East Asia & Pacific (IDA & IBRD countries)EcuadorEgypt, Arab Rep.El SalvadorEquatorial GuineaEritreaEstoniaEthiopiaEurope & Central Asia (excluding high income)Europe & Central Asia (IDA & IBRD countries)FijiFragile and conflict affected situationsGabonGambia, TheGeorgiaGhanaGrenadaGuatemalaGuineaGuinea-BissauGuyanaHaitiHeavily indebted poor countries (HIPC)High incomeHondurasHong Kong SAR, ChinaHungaryIBRD onlyIcelandIDA & IBRD totalIDA blendIDA onlyIDA totalIndiaIndonesiaIran, Islamic Rep.IraqIsraelJamaicaJapanJordanKazakhstanKenyaKorea, Rep.KuwaitKyrgyz RepublicLao PDRLate-demographic dividendLatin America & Caribbean Latin America & Caribbean (excluding high income)Latin America & the Caribbean (IDA & IBRD countries)LatviaLeast developed countries: UN classificationLebanonLesothoLiberiaLibyaLithuaniaLow & middle incomeLow incomeLower middle incomeMacao SAR, ChinaMacedonia, FYRMadagascarMalawiMalaysiaMaldivesMaliMauritaniaMauritiusMexicoMicronesia, Fed. Sts.Middle East & North AfricaMiddle East & North Africa (excluding high income)Middle East & North Africa (IDA & IBRD countries)Middle incomeMoldovaMongoliaMoroccoMozambiqueMyanmarNamibiaNepalNew ZealandNicaraguaNigerNigeriaNorth AmericaNorwayOECD membersOmanOther small statesPacific island small statesPakistanPanamaPapua New GuineaParaguayPeruPhilippinesPolandPost-demographic dividendPre-demographic dividendQatarRomaniaRussian FederationRwandaSamoaSao Tome and PrincipeSaudi ArabiaSenegalSerbiaSeychellesSierra LeoneSingaporeSlovak RepublicSmall statesSolomon IslandsSouth AfricaSouth AsiaSouth Asia (IDA & IBRD)South SudanSri LankaSt. Kitts and NevisSt. LuciaSt. Vincent and the GrenadinesSub-Saharan Africa Sub-Saharan Africa (excluding high income)Sub-Saharan Africa (IDA & IBRD countries)SudanSurinameSwazilandSwedenSwitzerlandSyrian Arab RepublicTajikistanTanzaniaThailandTimor-LesteTogoTongaTrinidad and TobagoTunisiaTurkeyUgandaUkraineUnited Arab EmiratesUnited KingdomUnited StatesUpper middle incomeUruguayVanuatuVenezuela, RBVietnamWest Bank and GazaWorldYemen, Rep.ZambiaZimbabwe Linha do tempo:
Nesta escala de tempo está apresentado um gráfico de 1985 ano até 2016 ano Macao SAR, China. Dados de 1984 ano ausente. O número de observações reais por data: 32.
Fonte (nome):
Indicadores de desenvolvimento mundial
Fonte (organização):
International Monetary Fund, International Financial Statistics and data files, and World Bank and OECD GDP estimates.
Categorias:
Financial Sector
Foi atualizado:
23 abr 2017 ano
Indicadores de alterações dos valores ao longo dos anos
Mínimo:
83.694
1 jan 1985 ano
Máximo:
182.07
1 jan 2000 ano
Na data de observação
Valor
Mudança absoluta
A alteração em relação ao valor anterior
1 jan 1985 ano
83.694
+83.694
0.0%
1 jan 1986 ano
94.621
+10.927
13.06%
1 jan 1987 ano
100.431
+5.81
6.14%
1 jan 1988 ano
99.766
-0.664
-0.66%
1 jan 1989 ano
119.184
+19.418
19.46%
1 jan 1990 ano
121.778
+2.594
2.18%
1 jan 1991 ano
127.774
+5.996
4.92%
1 jan 1992 ano
151.259
+23.486
18.38%
1 jan 1993 ano
139.097
-12.162
-8.04%
1 jan 1994 ano
129.101
-9.996
-7.19%
1 jan 1995 ano
131.035
+1.933
1.5%
1 jan 1996 ano
132.846
+1.811
1.38%
1 jan 1997 ano
140.767
+7.921
5.96%
1 jan 1998 ano
146.873
+6.106
4.34%
1 jan 1999 ano
163.345
+16.471
11.21%
1 jan 2000 ano
182.07
+18.726
11.46%
1 jan 2001 ano
173.399
-8.671
-4.76%
1 jan 2002 ano
167.312
-6.087
-3.51%
1 jan 2003 ano
168.224
+0.912
0.54%
1 jan 2004 ano
169.0
+0.777
0.46%
1 jan 2005 ano
142.426
-26.575
-15.72%
1 jan 2006 ano
140.04
-2.386
-1.68%
1 jan 2007 ano
142.737
+2.697
1.93%
1 jan 2008 ano
125.891
-16.846
-11.8%
1 jan 2009 ano
113.132
-12.759
-10.13%
1 jan 2010 ano
123.775
+10.643
9.41%
1 jan 2011 ano
107.999
-15.776
-12.75%
1 jan 2012 ano
101.229
-6.771
-6.27%
1 jan 2013 ano
109.057
+7.828
7.73%
1 jan 2014 ano
107.18
-1.876
-1.72%
1 jan 2015 ano
109.923
+2.742
2.56%
1 jan 2016 ano
128.233
+18.31
16.66%
Classificação de países por estatísticas atuais por anos


Comentários: