29
/pt/
pt
AIzaSyAYiBZKx7MnpbEhh9jyipgxe19OcubqV5w
April 1, 2024
211401
Niger
NER
true
2
1
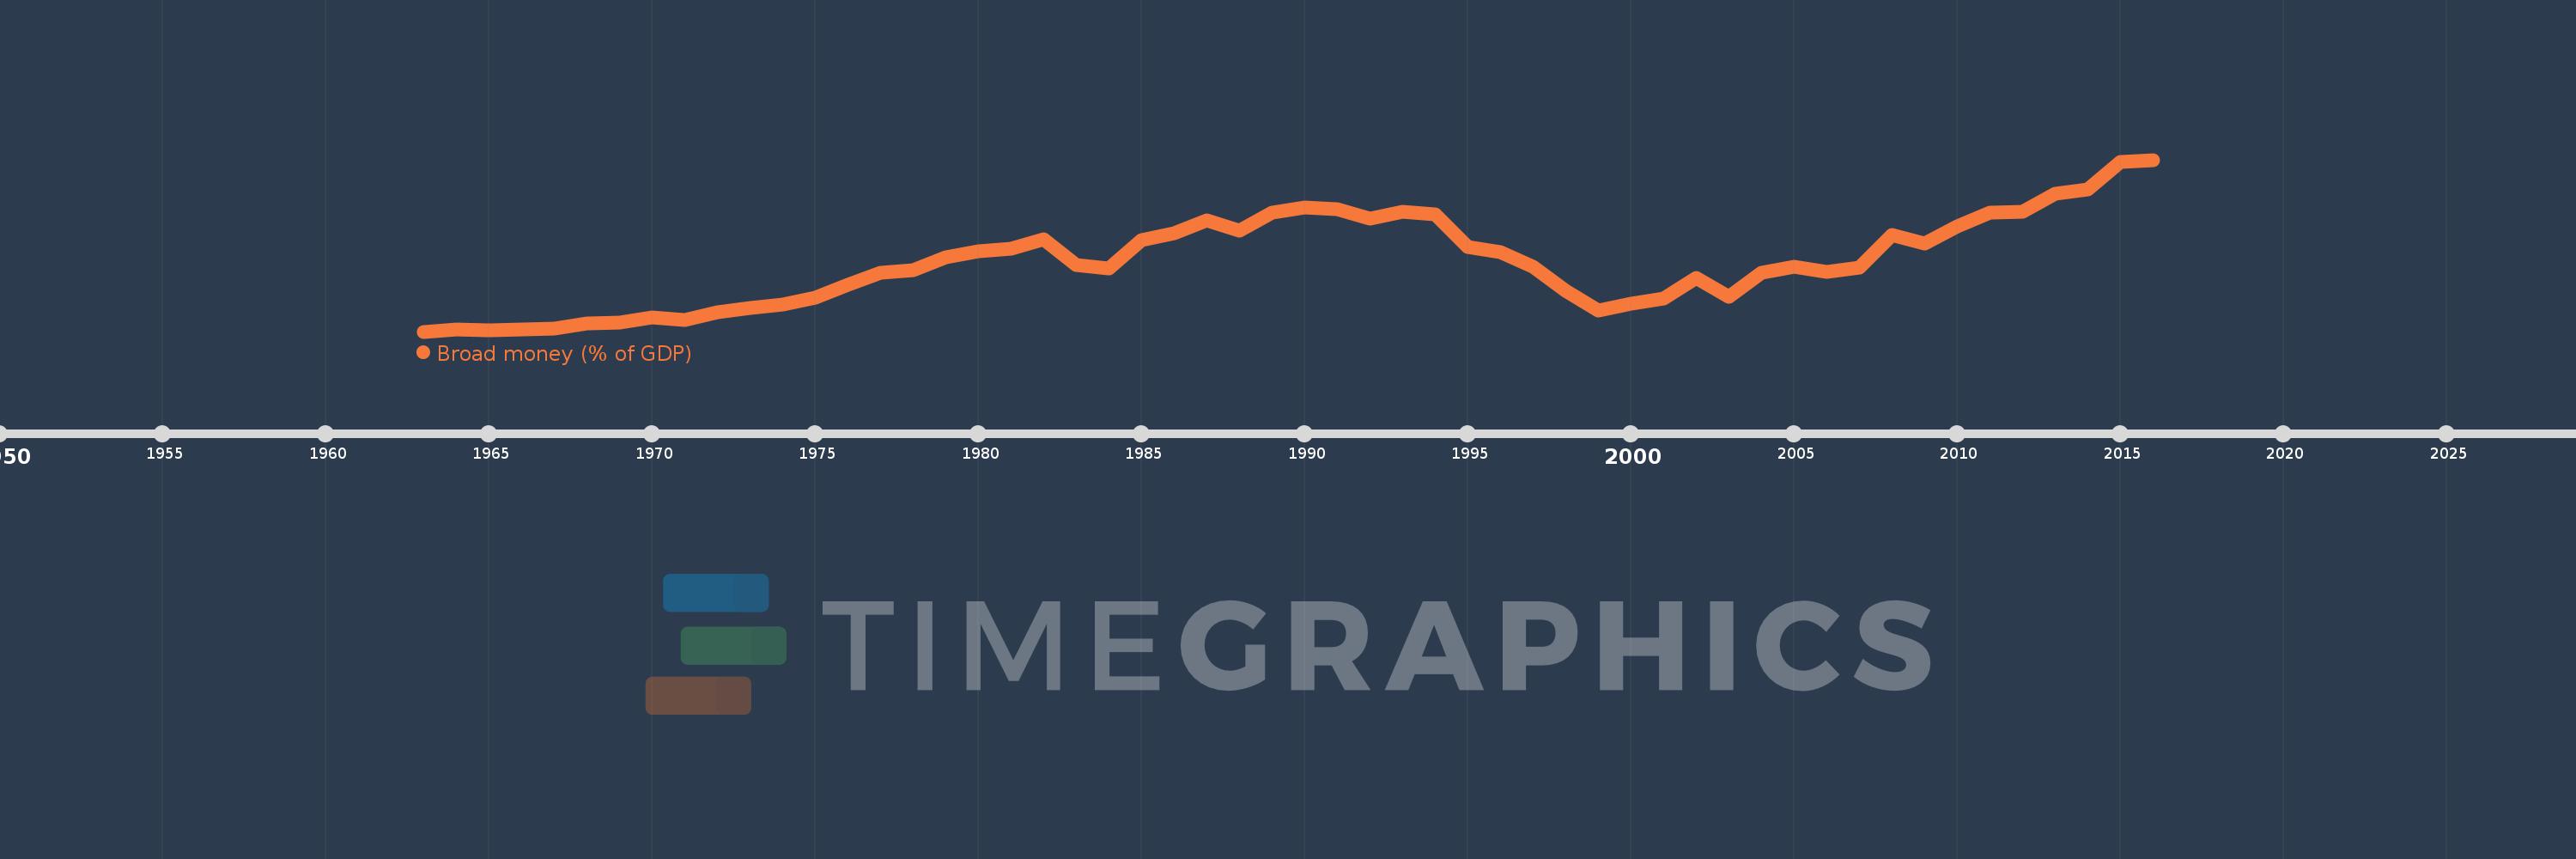
Broad money (% of GDP)
2016,2015,2014,2013,2012,2011,2010,2009,2008,2007,2006,2005,2004,2003,2002,2001,2000,1999,1998,1997,1996,1995,1994,1993,1992,1991,1990,1989,1988,1987,1986,1985,1984,1983,1982,1981,1980,1979,1978,1977,1976,1975,1974,1973,1972,1971,1970,1969,1968,1967,1966,1965,1964,1963
Estas estatísticas em outros países:
AfghanistanAlbaniaAlgeriaAngolaAntigua and BarbudaArab WorldArgentinaArmeniaArubaAustraliaAzerbaijanBahamas, TheBahrainBangladeshBarbadosBelarusBelizeBeninBhutanBoliviaBosnia and HerzegovinaBotswanaBrazilBrunei DarussalamBulgariaBurkina FasoBurundiCabo VerdeCambodiaCameroonCanadaCaribbean small statesCentral African RepublicCentral Europe and the BalticsChadChileChinaColombiaComorosCongo, Dem. Rep.Congo, Rep.Costa RicaCote d'IvoireCroatiaCzech RepublicDenmarkDjiboutiDominicaDominican RepublicEarly-demographic dividendEast Asia & PacificEast Asia & Pacific (excluding high income)East Asia & Pacific (IDA & IBRD countries)EcuadorEgypt, Arab Rep.El SalvadorEquatorial GuineaEritreaEstoniaEthiopiaEurope & Central Asia (excluding high income)Europe & Central Asia (IDA & IBRD countries)FijiFragile and conflict affected situationsGabonGambia, TheGeorgiaGhanaGrenadaGuatemalaGuineaGuinea-BissauGuyanaHaitiHeavily indebted poor countries (HIPC)High incomeHondurasHong Kong SAR, ChinaHungaryIBRD onlyIcelandIDA & IBRD totalIDA blendIDA onlyIDA totalIndiaIndonesiaIran, Islamic Rep.IraqIsraelJamaicaJapanJordanKazakhstanKenyaKorea, Rep.KuwaitKyrgyz RepublicLao PDRLate-demographic dividendLatin America & Caribbean Latin America & Caribbean (excluding high income)Latin America & the Caribbean (IDA & IBRD countries)LatviaLeast developed countries: UN classificationLebanonLesothoLiberiaLibyaLithuaniaLow & middle incomeLow incomeLower middle incomeMacao SAR, ChinaMacedonia, FYRMadagascarMalawiMalaysiaMaldivesMaliMauritaniaMauritiusMexicoMicronesia, Fed. Sts.Middle East & North AfricaMiddle East & North Africa (excluding high income)Middle East & North Africa (IDA & IBRD countries)Middle incomeMoldovaMongoliaMoroccoMozambiqueMyanmarNamibiaNepalNew ZealandNicaraguaNigerNigeriaNorth AmericaNorwayOECD membersOmanOther small statesPacific island small statesPakistanPanamaPapua New GuineaParaguayPeruPhilippinesPolandPost-demographic dividendPre-demographic dividendQatarRomaniaRussian FederationRwandaSamoaSao Tome and PrincipeSaudi ArabiaSenegalSerbiaSeychellesSierra LeoneSingaporeSlovak RepublicSmall statesSolomon IslandsSouth AfricaSouth AsiaSouth Asia (IDA & IBRD)South SudanSri LankaSt. Kitts and NevisSt. LuciaSt. Vincent and the GrenadinesSub-Saharan Africa Sub-Saharan Africa (excluding high income)Sub-Saharan Africa (IDA & IBRD countries)SudanSurinameSwazilandSwedenSwitzerlandSyrian Arab RepublicTajikistanTanzaniaThailandTimor-LesteTogoTongaTrinidad and TobagoTunisiaTurkeyUgandaUkraineUnited Arab EmiratesUnited KingdomUnited StatesUpper middle incomeUruguayVanuatuVenezuela, RBVietnamWest Bank and GazaWorldYemen, Rep.ZambiaZimbabwe Linha do tempo:
Nesta escala de tempo está apresentado um gráfico de 1963 ano até 2016 ano Niger. Dados de 1962 ano ausente. O número de observações reais por data: 54.
Fonte (nome):
Indicadores de desenvolvimento mundial
Fonte (organização):
International Monetary Fund, International Financial Statistics and data files, and World Bank and OECD GDP estimates.
Categorias:
Financial Sector
Foi atualizado:
23 abr 2017 ano
Indicadores de alterações dos valores ao longo dos anos
Mínimo:
3.807
1 jan 1963 ano
Máximo:
26.329
1 jan 2016 ano
Na data de observação
Valor
Mudança absoluta
A alteração em relação ao valor anterior
1 jan 1963 ano
3.807
+3.807
0.0%
1 jan 1964 ano
4.093
+0.286
7.52%
1 jan 1965 ano
4.019
-0.074
-1.8%
1 jan 1966 ano
4.072
+0.053
1.31%
1 jan 1967 ano
4.248
+0.176
4.32%
1 jan 1968 ano
4.825
+0.577
13.57%
1 jan 1969 ano
5.021
+0.196
4.07%
1 jan 1970 ano
5.663
+0.642
12.78%
1 jan 1971 ano
5.342
-0.321
-5.67%
1 jan 1972 ano
6.354
+1.012
18.95%
1 jan 1973 ano
6.889
+0.535
8.42%
1 jan 1974 ano
7.35
+0.461
6.69%
1 jan 1975 ano
8.225
+0.875
11.9%
1 jan 1976 ano
9.925
+1.7
20.67%
1 jan 1977 ano
11.495
+1.57
15.82%
1 jan 1978 ano
11.862
+0.367
3.2%
1 jan 1979 ano
13.537
+1.675
14.12%
1 jan 1980 ano
14.377
+0.84
6.2%
1 jan 1981 ano
14.704
+0.328
2.28%
1 jan 1982 ano
15.947
+1.242
8.45%
1 jan 1983 ano
12.515
-3.431
-21.52%
1 jan 1984 ano
12.034
-0.481
-3.84%
1 jan 1985 ano
15.822
+3.788
31.47%
1 jan 1986 ano
16.704
+0.881
5.57%
1 jan 1987 ano
18.358
+1.654
9.9%
1 jan 1988 ano
17.053
-1.305
-7.11%
1 jan 1989 ano
19.407
+2.354
13.8%
1 jan 1990 ano
20.058
+0.651
3.35%
1 jan 1991 ano
19.812
-0.246
-1.22%
1 jan 1992 ano
18.57
-1.242
-6.27%
1 jan 1993 ano
19.46
+0.89
4.79%
1 jan 1994 ano
19.223
-0.237
-1.22%
1 jan 1995 ano
14.864
-4.359
-22.68%
1 jan 1996 ano
14.257
-0.607
-4.08%
1 jan 1997 ano
12.296
-1.961
-13.76%
1 jan 1998 ano
9.133
-3.163
-25.72%
1 jan 1999 ano
6.546
-2.587
-28.32%
1 jan 2000 ano
7.449
+0.903
13.79%
1 jan 2001 ano
8.156
+0.707
9.48%
1 jan 2002 ano
10.883
+2.727
33.44%
1 jan 2003 ano
8.365
-2.518
-23.14%
1 jan 2004 ano
11.53
+3.166
37.85%
1 jan 2005 ano
12.329
+0.799
6.93%
1 jan 2006 ano
11.6
-0.729
-5.91%
1 jan 2007 ano
12.206
+0.606
5.22%
1 jan 2008 ano
16.53
+4.324
35.43%
1 jan 2009 ano
15.373
-1.157
-7.0%
1 jan 2010 ano
17.623
+2.25
14.64%
1 jan 2011 ano
19.448
+1.825
10.35%
1 jan 2012 ano
19.468
+0.02
0.1%
1 jan 2013 ano
21.885
+2.417
12.41%
1 jan 2014 ano
22.473
+0.589
2.69%
1 jan 2015 ano
26.092
+3.619
16.1%
1 jan 2016 ano
26.329
+0.237
0.91%
Classificação de países por estatísticas atuais por anos


Comentários: