29
/pt/
pt
AIzaSyAYiBZKx7MnpbEhh9jyipgxe19OcubqV5w
April 1, 2024
240583
Singapore
SGP
true
2
1
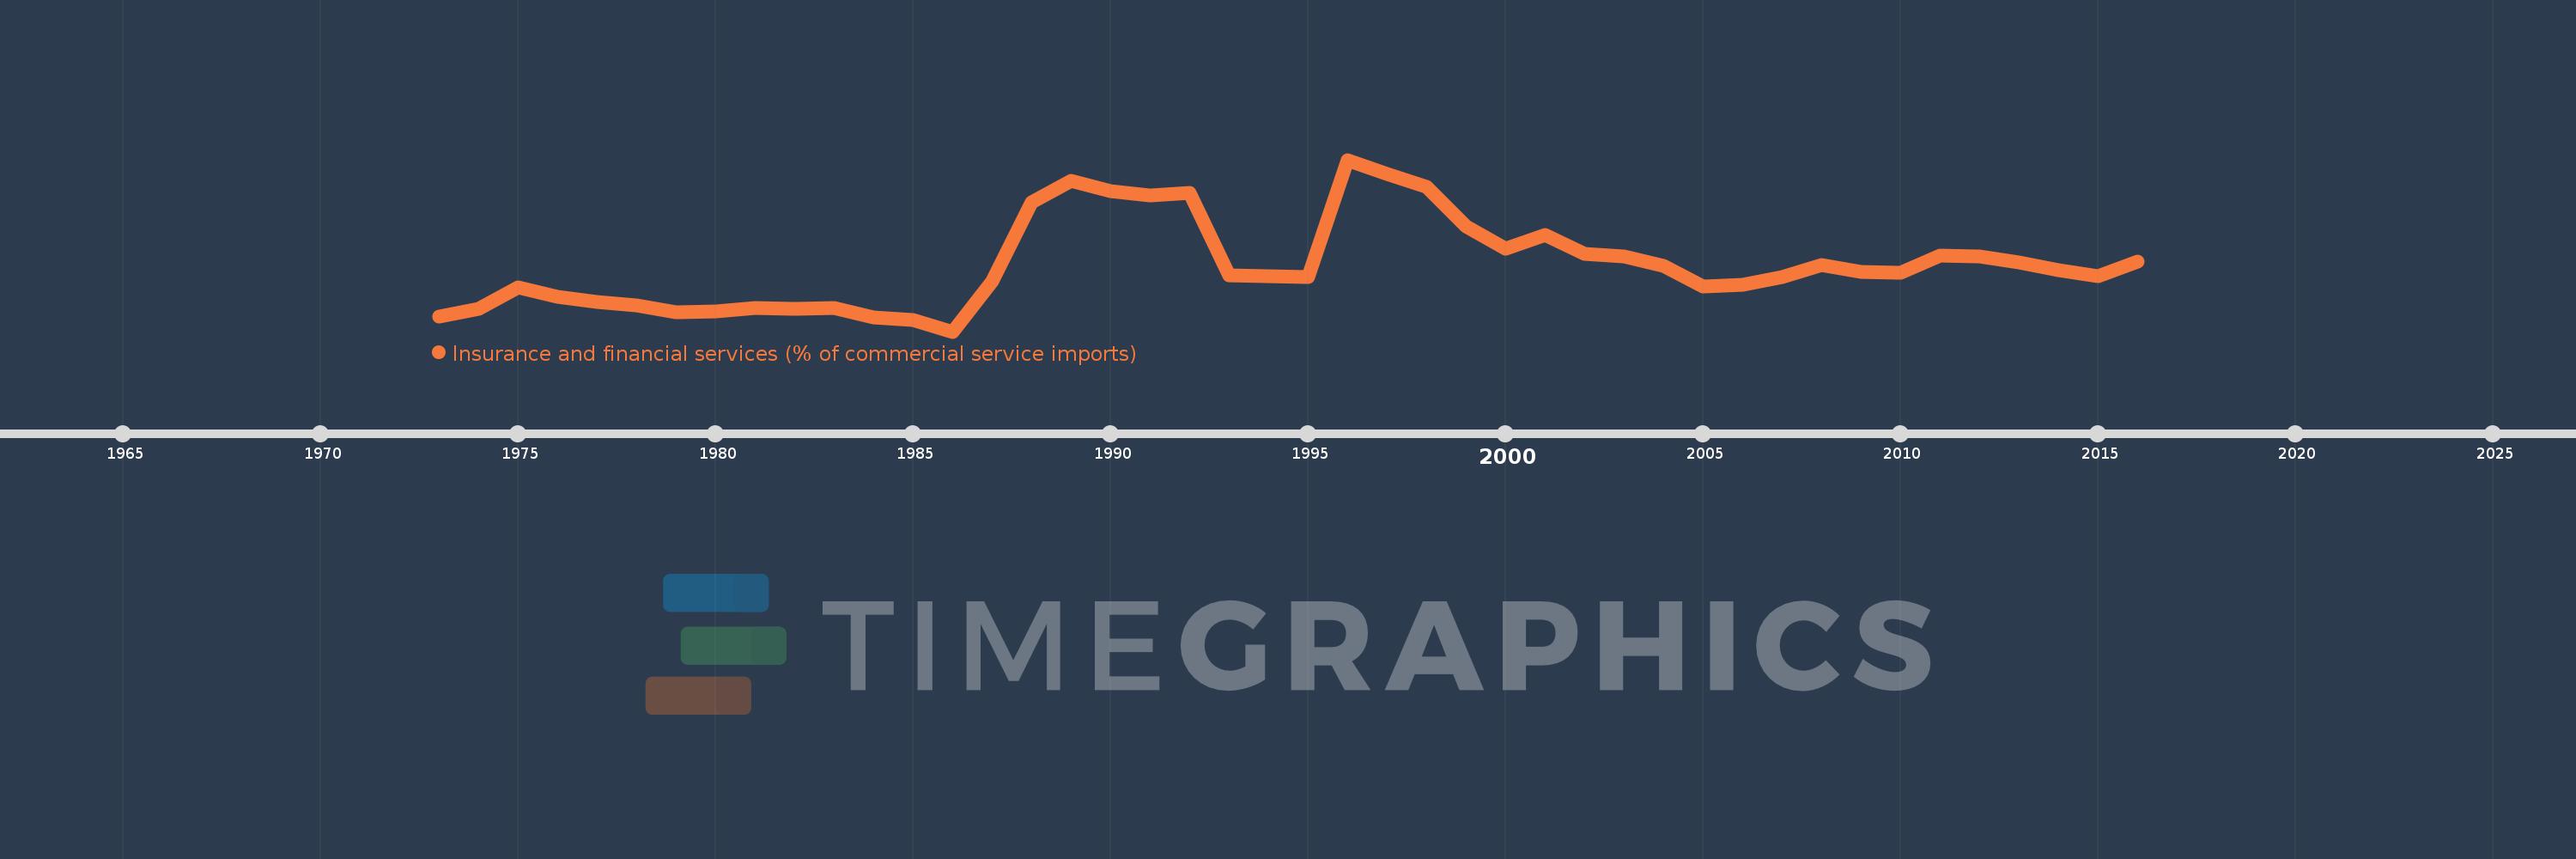
Insurance and financial services (% of commercial service imports)
2016,2015,2014,2013,2012,2011,2010,2009,2008,2007,2006,2005,2004,2003,2002,2001,2000,1999,1998,1997,1996,1995,1994,1993,1992,1991,1990,1989,1988,1987,1986,1985,1984,1983,1982,1981,1980,1979,1978,1977,1976,1975,1974,1973
Estas estatísticas em outros países:
AfghanistanAlbaniaAlgeriaAngolaAntigua and BarbudaArab WorldArgentinaArmeniaArubaAustraliaAustriaAzerbaijanBahamas, TheBahrainBangladeshBarbadosBelarusBelgiumBelizeBeninBermudaBhutanBoliviaBosnia and HerzegovinaBotswanaBrazilBrunei DarussalamBulgariaBurkina FasoBurundiCabo VerdeCambodiaCameroonCanadaCaribbean small statesCentral African RepublicCentral Europe and the BalticsChadChileChinaColombiaComorosCongo, Dem. Rep.Congo, Rep.Costa RicaCote d'IvoireCroatiaCuracaoCyprusCzech RepublicDenmarkDjiboutiDominicaDominican RepublicEarly-demographic dividendEast Asia & PacificEast Asia & Pacific (excluding high income)East Asia & Pacific (IDA & IBRD countries)EcuadorEgypt, Arab Rep.El SalvadorEquatorial GuineaEritreaEstoniaEthiopiaEuro areaEurope & Central AsiaEurope & Central Asia (excluding high income)Europe & Central Asia (IDA & IBRD countries)European UnionFaroe IslandsFijiFinlandFragile and conflict affected situationsFranceFrench PolynesiaGabonGambia, TheGeorgiaGermanyGhanaGreeceGrenadaGuatemalaGuineaGuinea-BissauGuyanaHaitiHeavily indebted poor countries (HIPC)High incomeHondurasHong Kong SAR, ChinaHungaryIBRD onlyIcelandIDA & IBRD totalIDA onlyIDA totalIndiaIndonesiaIran, Islamic Rep.IraqIrelandIsraelItalyJamaicaJapanJordanKazakhstanKenyaKiribatiKorea, Rep.KosovoKuwaitKyrgyz RepublicLao PDRLate-demographic dividendLatin America & Caribbean Latin America & Caribbean (excluding high income)Latin America & the Caribbean (IDA & IBRD countries)LatviaLeast developed countries: UN classificationLebanonLesothoLiberiaLibyaLithuaniaLow & middle incomeLow incomeLower middle incomeLuxembourgMacao SAR, ChinaMacedonia, FYRMadagascarMalawiMalaysiaMaldivesMaliMaltaMarshall IslandsMauritaniaMauritiusMexicoMicronesia, Fed. Sts.Middle East & North AfricaMiddle East & North Africa (excluding high income)Middle East & North Africa (IDA & IBRD countries)Middle incomeMoldovaMongoliaMontenegroMoroccoMozambiqueMyanmarNamibiaNepalNetherlandsNew CaledoniaNew ZealandNicaraguaNigerNigeriaNorth AmericaNorwayOECD membersOmanOther small statesPacific island small statesPakistanPalauPanamaPapua New GuineaParaguayPeruPhilippinesPolandPortugalPost-demographic dividendPre-demographic dividendQatarRomaniaRussian FederationRwandaSamoaSao Tome and PrincipeSaudi ArabiaSenegalSerbiaSeychellesSierra LeoneSingaporeSint Maarten (Dutch part)Slovak RepublicSloveniaSmall statesSolomon IslandsSouth AfricaSouth AsiaSouth Asia (IDA & IBRD)South SudanSpainSri LankaSt. Kitts and NevisSt. LuciaSt. Vincent and the GrenadinesSub-Saharan Africa Sub-Saharan Africa (excluding high income)Sub-Saharan Africa (IDA & IBRD countries)SudanSurinameSwazilandSwedenSwitzerlandSyrian Arab RepublicTajikistanTanzaniaThailandTimor-LesteTogoTongaTrinidad and TobagoTunisiaTurkeyTuvaluUgandaUkraineUnited KingdomUnited StatesUpper middle incomeUruguayVanuatuVenezuela, RBWest Bank and GazaWorldYemen, Rep.ZambiaZimbabwe Linha do tempo:
Nesta escala de tempo está apresentado um gráfico de 1973 ano até 2016 ano Singapore. Dados de 1972 ano ausente. O número de observações reais por data: 44.
Fonte (nome):
Indicadores de desenvolvimento mundial
Fonte (organização):
International Monetary Fund, Balance of Payments Statistics Yearbook and data files.
Categorias:
Private Sector, Trade
Foi atualizado:
23 abr 2017 ano
Indicadores de alterações dos valores ao longo dos anos
Mínimo:
3.274
1 jan 1986 ano
Máximo:
10.609
1 jan 1996 ano
Na data de observação
Valor
Mudança absoluta
A alteração em relação ao valor anterior
1 jan 1973 ano
3.92
+3.92
0.0%
1 jan 1974 ano
4.253
+0.333
8.48%
1 jan 1975 ano
5.179
+0.926
21.78%
1 jan 1976 ano
4.747
-0.431
-8.33%
1 jan 1977 ano
4.523
-0.225
-4.73%
1 jan 1978 ano
4.397
-0.126
-2.78%
1 jan 1979 ano
4.086
-0.311
-7.08%
1 jan 1980 ano
4.129
+0.043
1.06%
1 jan 1981 ano
4.282
+0.153
3.72%
1 jan 1982 ano
4.253
-0.03
-0.69%
1 jan 1983 ano
4.266
+0.013
0.31%
1 jan 1984 ano
3.89
-0.376
-8.81%
1 jan 1985 ano
3.764
-0.127
-3.25%
1 jan 1986 ano
3.274
-0.49
-13.02%
1 jan 1987 ano
5.414
+2.14
65.37%
1 jan 1988 ano
8.796
+3.382
62.46%
1 jan 1989 ano
9.708
+0.913
10.38%
1 jan 1990 ano
9.285
-0.424
-4.37%
1 jan 1991 ano
9.084
-0.201
-2.16%
1 jan 1992 ano
9.189
+0.106
1.16%
1 jan 1993 ano
5.659
-3.531
-38.42%
1 jan 1994 ano
5.639
-0.019
-0.34%
1 jan 1995 ano
5.587
-0.052
-0.93%
1 jan 1996 ano
10.609
+5.023
89.9%
1 jan 1997 ano
9.994
-0.616
-5.8%
1 jan 1998 ano
9.467
-0.527
-5.27%
1 jan 1999 ano
7.77
-1.697
-17.92%
1 jan 2000 ano
6.796
-0.974
-12.53%
1 jan 2001 ano
7.398
+0.601
8.85%
1 jan 2002 ano
6.598
-0.8
-10.82%
1 jan 2003 ano
6.501
-0.097
-1.47%
1 jan 2004 ano
6.091
-0.409
-6.3%
1 jan 2005 ano
5.211
-0.88
-14.45%
1 jan 2006 ano
5.273
+0.062
1.18%
1 jan 2007 ano
5.6
+0.327
6.2%
1 jan 2008 ano
6.122
+0.522
9.33%
1 jan 2009 ano
5.806
-0.317
-5.17%
1 jan 2010 ano
5.779
-0.026
-0.45%
1 jan 2011 ano
6.537
+0.757
13.1%
1 jan 2012 ano
6.478
-0.059
-0.9%
1 jan 2013 ano
6.211
-0.267
-4.12%
1 jan 2014 ano
5.891
-0.32
-5.15%
1 jan 2015 ano
5.657
-0.234
-3.97%
1 jan 2016 ano
6.251
+0.594
10.49%
Classificação de países por estatísticas atuais por anos


Comentários: