29
/pt/
pt
AIzaSyAYiBZKx7MnpbEhh9jyipgxe19OcubqV5w
April 1, 2024
105025
Chile
CHL
true
2
1
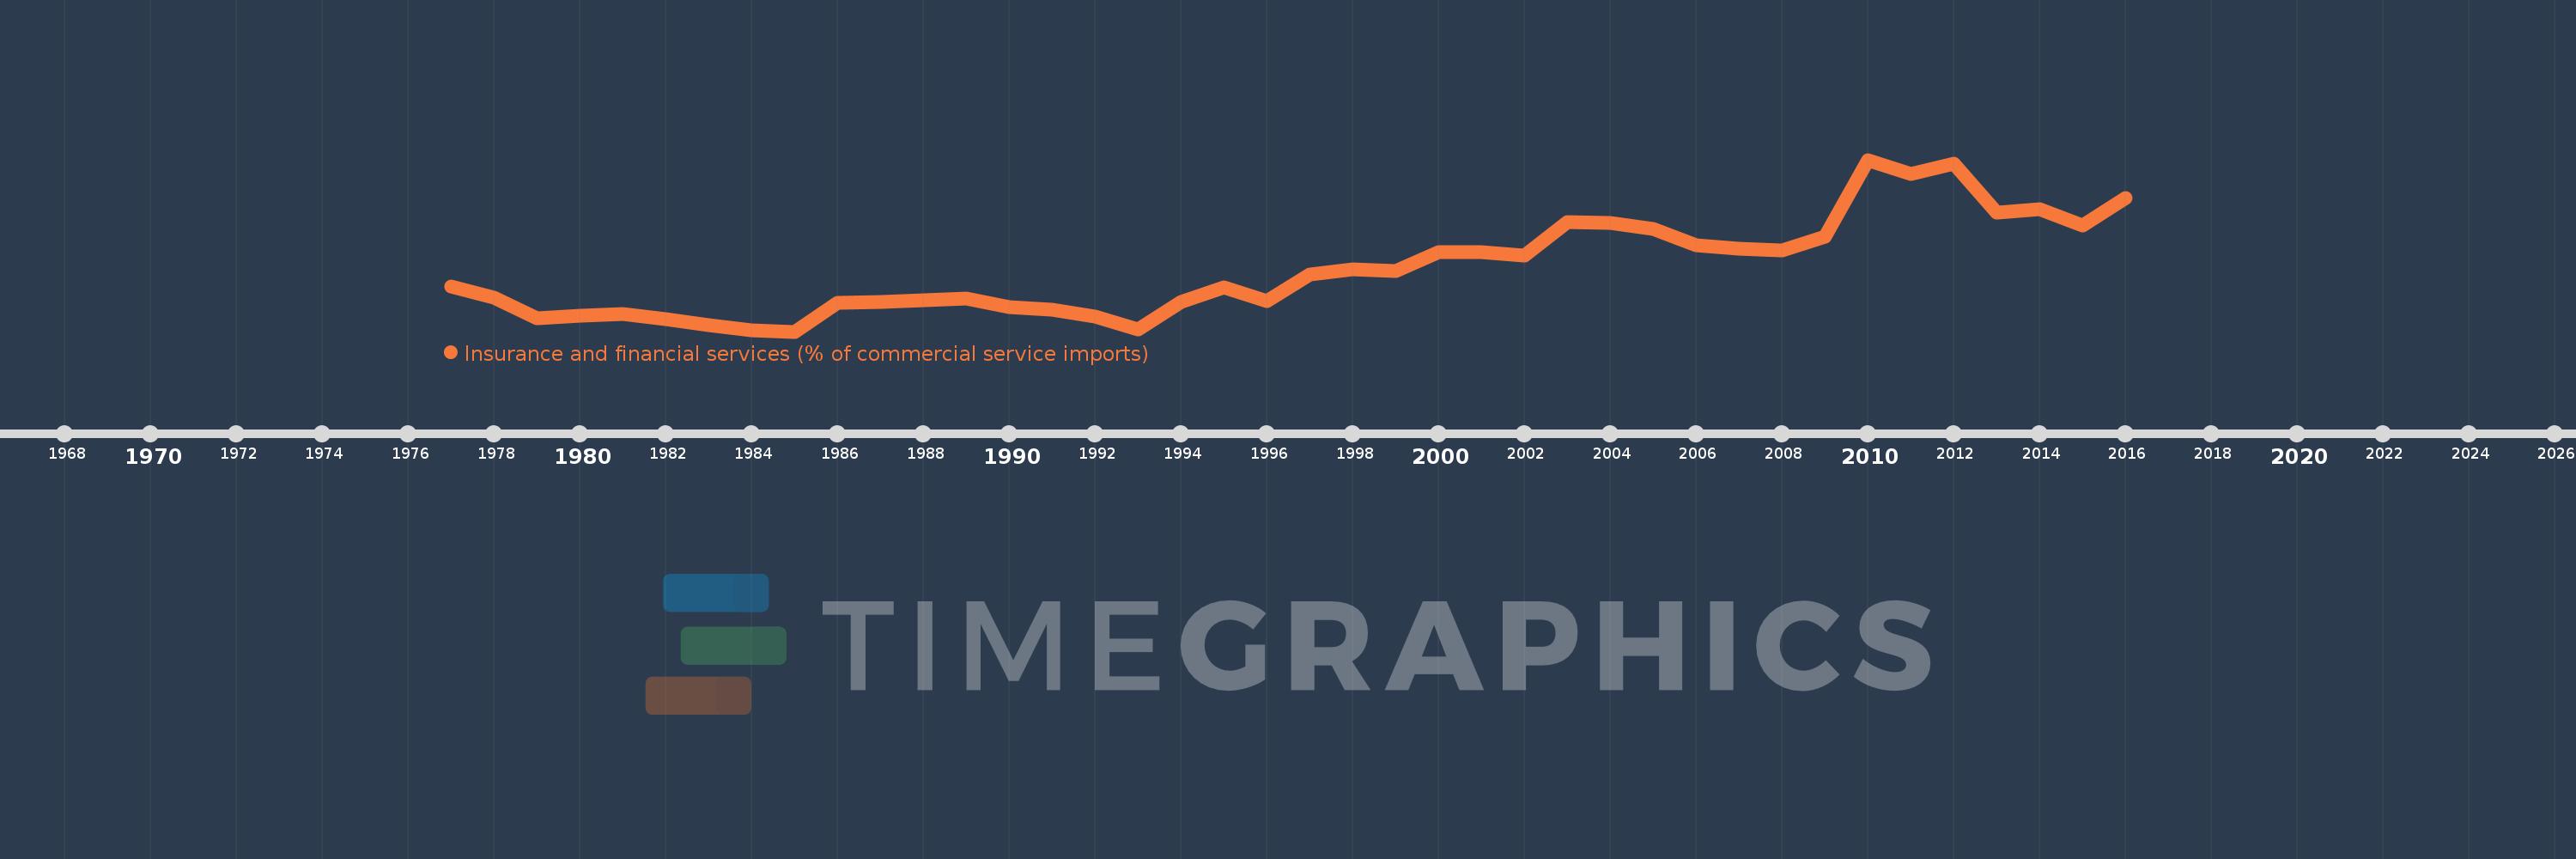
Insurance and financial services (% of commercial service imports)
2016,2015,2014,2013,2012,2011,2010,2009,2008,2007,2006,2005,2004,2003,2002,2001,2000,1999,1998,1997,1996,1995,1994,1993,1992,1991,1990,1989,1988,1987,1986,1985,1984,1983,1982,1981,1980,1979,1978,1977
Estas estatísticas em outros países:
AfghanistanAlbaniaAlgeriaAngolaAntigua and BarbudaArab WorldArgentinaArmeniaArubaAustraliaAustriaAzerbaijanBahamas, TheBahrainBangladeshBarbadosBelarusBelgiumBelizeBeninBermudaBhutanBoliviaBosnia and HerzegovinaBotswanaBrazilBrunei DarussalamBulgariaBurkina FasoBurundiCabo VerdeCambodiaCameroonCanadaCaribbean small statesCentral African RepublicCentral Europe and the BalticsChadChileChinaColombiaComorosCongo, Dem. Rep.Congo, Rep.Costa RicaCote d'IvoireCroatiaCuracaoCyprusCzech RepublicDenmarkDjiboutiDominicaDominican RepublicEarly-demographic dividendEast Asia & PacificEast Asia & Pacific (excluding high income)East Asia & Pacific (IDA & IBRD countries)EcuadorEgypt, Arab Rep.El SalvadorEquatorial GuineaEritreaEstoniaEthiopiaEuro areaEurope & Central AsiaEurope & Central Asia (excluding high income)Europe & Central Asia (IDA & IBRD countries)European UnionFaroe IslandsFijiFinlandFragile and conflict affected situationsFranceFrench PolynesiaGabonGambia, TheGeorgiaGermanyGhanaGreeceGrenadaGuatemalaGuineaGuinea-BissauGuyanaHaitiHeavily indebted poor countries (HIPC)High incomeHondurasHong Kong SAR, ChinaHungaryIBRD onlyIcelandIDA & IBRD totalIDA onlyIDA totalIndiaIndonesiaIran, Islamic Rep.IraqIrelandIsraelItalyJamaicaJapanJordanKazakhstanKenyaKiribatiKorea, Rep.KosovoKuwaitKyrgyz RepublicLao PDRLate-demographic dividendLatin America & Caribbean Latin America & Caribbean (excluding high income)Latin America & the Caribbean (IDA & IBRD countries)LatviaLeast developed countries: UN classificationLebanonLesothoLiberiaLibyaLithuaniaLow & middle incomeLow incomeLower middle incomeLuxembourgMacao SAR, ChinaMacedonia, FYRMadagascarMalawiMalaysiaMaldivesMaliMaltaMarshall IslandsMauritaniaMauritiusMexicoMicronesia, Fed. Sts.Middle East & North AfricaMiddle East & North Africa (excluding high income)Middle East & North Africa (IDA & IBRD countries)Middle incomeMoldovaMongoliaMontenegroMoroccoMozambiqueMyanmarNamibiaNepalNetherlandsNew CaledoniaNew ZealandNicaraguaNigerNigeriaNorth AmericaNorwayOECD membersOmanOther small statesPacific island small statesPakistanPalauPanamaPapua New GuineaParaguayPeruPhilippinesPolandPortugalPost-demographic dividendPre-demographic dividendQatarRomaniaRussian FederationRwandaSamoaSao Tome and PrincipeSaudi ArabiaSenegalSerbiaSeychellesSierra LeoneSingaporeSint Maarten (Dutch part)Slovak RepublicSloveniaSmall statesSolomon IslandsSouth AfricaSouth AsiaSouth Asia (IDA & IBRD)South SudanSpainSri LankaSt. Kitts and NevisSt. LuciaSt. Vincent and the GrenadinesSub-Saharan Africa Sub-Saharan Africa (excluding high income)Sub-Saharan Africa (IDA & IBRD countries)SudanSurinameSwazilandSwedenSwitzerlandSyrian Arab RepublicTajikistanTanzaniaThailandTimor-LesteTogoTongaTrinidad and TobagoTunisiaTurkeyTuvaluUgandaUkraineUnited KingdomUnited StatesUpper middle incomeUruguayVanuatuVenezuela, RBWest Bank and GazaWorldYemen, Rep.ZambiaZimbabwe Linha do tempo:
Nesta escala de tempo está apresentado um gráfico de 1977 ano até 2016 ano Chile. Dados de 1976 ano ausente. O número de observações reais por data: 40.
Fonte (nome):
Indicadores de desenvolvimento mundial
Fonte (organização):
International Monetary Fund, Balance of Payments Statistics Yearbook and data files.
Categorias:
Private Sector, Trade
Foi atualizado:
23 abr 2017 ano
Indicadores de alterações dos valores ao longo dos anos
Mínimo:
1.167
1 jan 1985 ano
Máximo:
17.57
1 jan 2010 ano
Na data de observação
Valor
Mudança absoluta
A alteração em relação ao valor anterior
1 jan 1977 ano
5.476
+5.476
0.0%
1 jan 1978 ano
4.444
-1.032
-18.84%
1 jan 1979 ano
2.453
-1.991
-44.81%
1 jan 1980 ano
2.68
+0.227
9.27%
1 jan 1981 ano
2.815
+0.135
5.02%
1 jan 1982 ano
2.327
-0.488
-17.34%
1 jan 1983 ano
1.758
-0.569
-24.43%
1 jan 1984 ano
1.254
-0.504
-28.66%
1 jan 1985 ano
1.167
-0.088
-6.98%
1 jan 1986 ano
3.882
+2.715
232.62%
1 jan 1987 ano
4.033
+0.151
3.89%
1 jan 1988 ano
4.127
+0.095
2.34%
1 jan 1989 ano
4.293
+0.166
4.02%
1 jan 1990 ano
3.472
-0.821
-19.11%
1 jan 1991 ano
3.254
-0.218
-6.28%
1 jan 1992 ano
2.563
-0.692
-21.26%
1 jan 1993 ano
1.339
-1.224
-47.76%
1 jan 1994 ano
3.996
+2.658
198.53%
1 jan 1995 ano
5.408
+1.412
35.32%
1 jan 1996 ano
4.086
-1.322
-24.44%
1 jan 1997 ano
6.609
+2.523
61.74%
1 jan 1998 ano
7.09
+0.481
7.27%
1 jan 1999 ano
6.922
-0.167
-2.36%
1 jan 2000 ano
8.717
+1.794
25.92%
1 jan 2001 ano
8.758
+0.041
0.48%
1 jan 2002 ano
8.414
-0.344
-3.92%
1 jan 2003 ano
11.657
+3.243
38.54%
1 jan 2004 ano
11.567
-0.09
-0.77%
1 jan 2005 ano
10.927
-0.64
-5.53%
1 jan 2006 ano
9.417
-1.51
-13.82%
1 jan 2007 ano
9.051
-0.366
-3.89%
1 jan 2008 ano
8.914
-0.137
-1.52%
1 jan 2009 ano
10.208
+1.294
14.52%
1 jan 2010 ano
17.57
+7.362
72.13%
1 jan 2011 ano
16.233
-1.336
-7.61%
1 jan 2012 ano
17.169
+0.936
5.76%
1 jan 2013 ano
12.555
-4.614
-26.87%
1 jan 2014 ano
12.853
+0.298
2.37%
1 jan 2015 ano
11.271
-1.582
-12.31%
1 jan 2016 ano
13.931
+2.659
23.59%
Classificação de países por estatísticas atuais por anos


Comentários: