29
/pt/
pt
AIzaSyAYiBZKx7MnpbEhh9jyipgxe19OcubqV5w
April 1, 2024
225000
Poland
POL
true
2
1
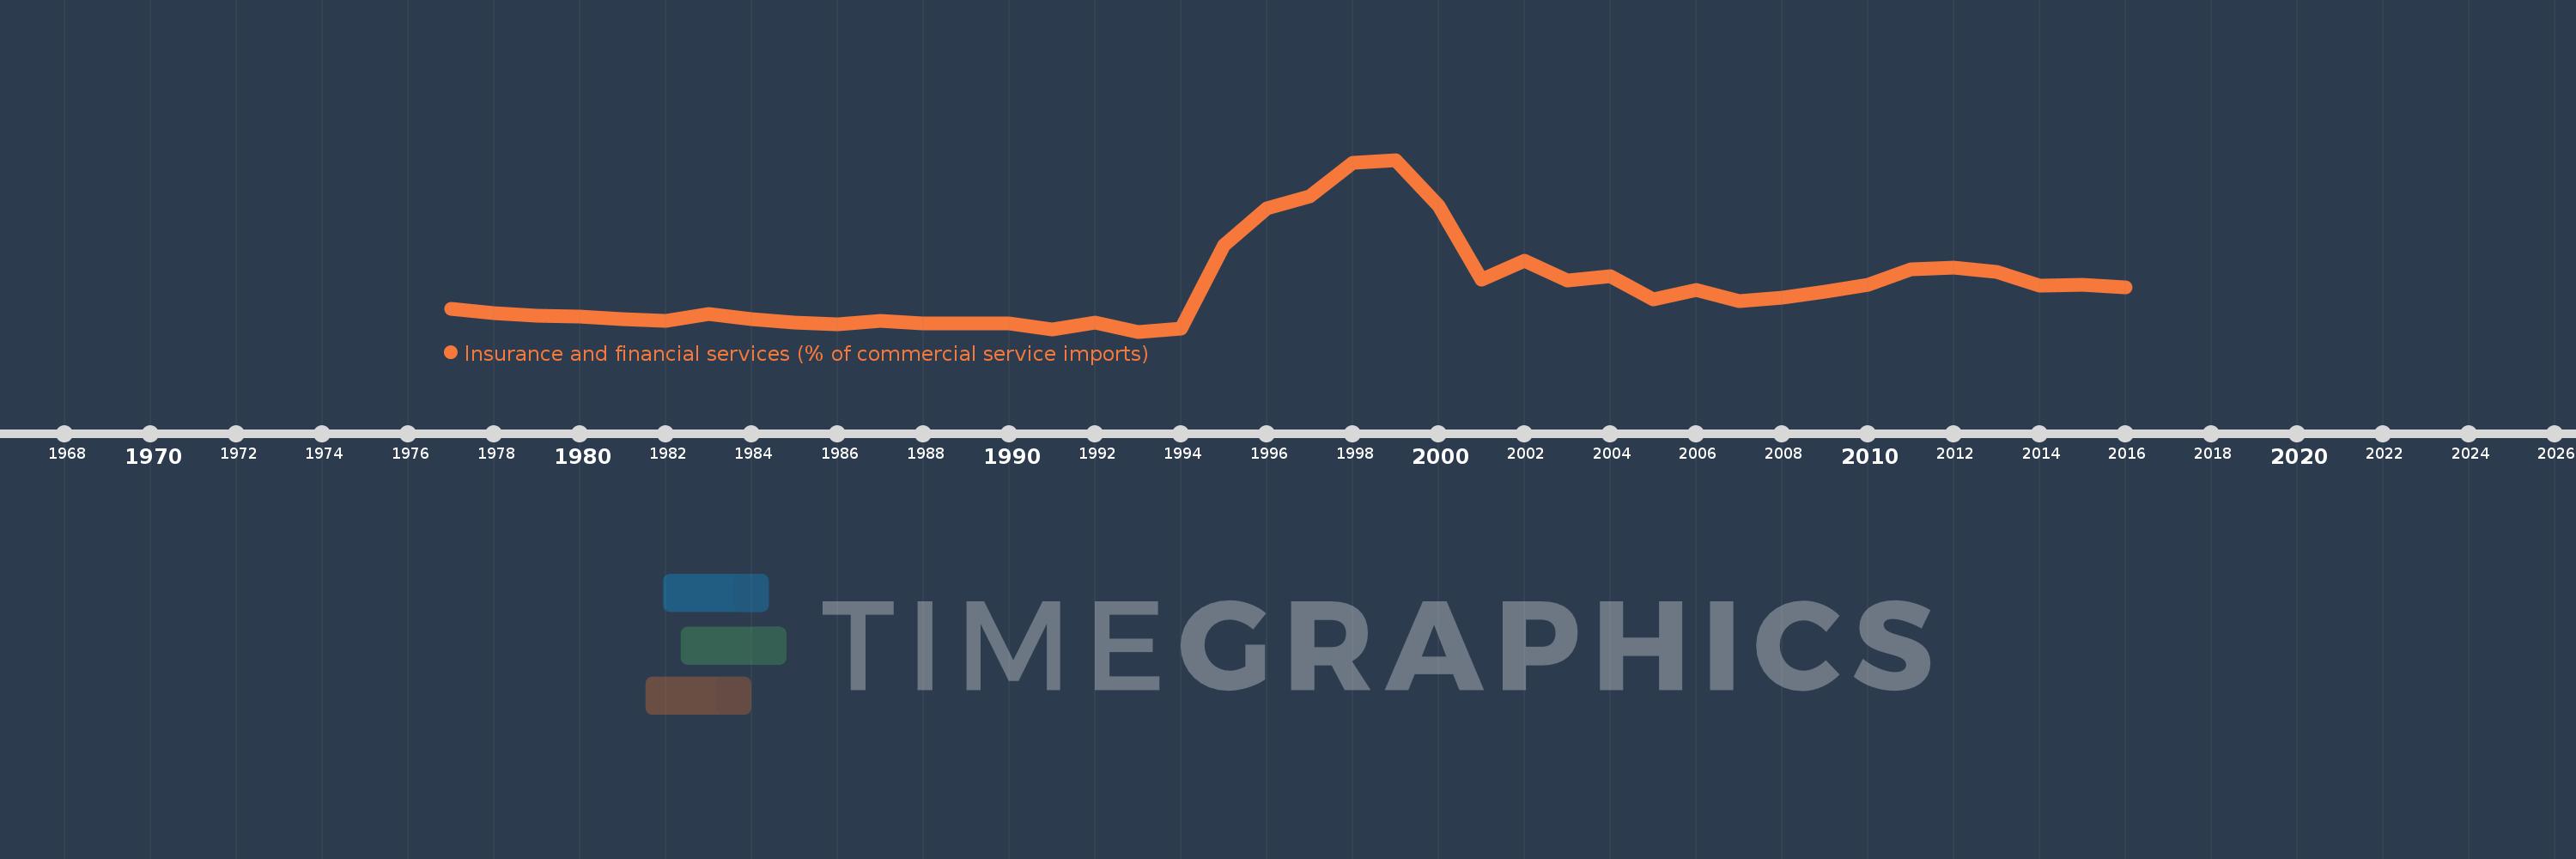
Insurance and financial services (% of commercial service imports)
2016,2015,2014,2013,2012,2011,2010,2009,2008,2007,2006,2005,2004,2003,2002,2001,2000,1999,1998,1997,1996,1995,1994,1993,1992,1991,1990,1989,1988,1987,1986,1985,1984,1983,1982,1981,1980,1979,1978,1977
Estas estatísticas em outros países:
AfghanistanAlbaniaAlgeriaAngolaAntigua and BarbudaArab WorldArgentinaArmeniaArubaAustraliaAustriaAzerbaijanBahamas, TheBahrainBangladeshBarbadosBelarusBelgiumBelizeBeninBermudaBhutanBoliviaBosnia and HerzegovinaBotswanaBrazilBrunei DarussalamBulgariaBurkina FasoBurundiCabo VerdeCambodiaCameroonCanadaCaribbean small statesCentral African RepublicCentral Europe and the BalticsChadChileChinaColombiaComorosCongo, Dem. Rep.Congo, Rep.Costa RicaCote d'IvoireCroatiaCuracaoCyprusCzech RepublicDenmarkDjiboutiDominicaDominican RepublicEarly-demographic dividendEast Asia & PacificEast Asia & Pacific (excluding high income)East Asia & Pacific (IDA & IBRD countries)EcuadorEgypt, Arab Rep.El SalvadorEquatorial GuineaEritreaEstoniaEthiopiaEuro areaEurope & Central AsiaEurope & Central Asia (excluding high income)Europe & Central Asia (IDA & IBRD countries)European UnionFaroe IslandsFijiFinlandFragile and conflict affected situationsFranceFrench PolynesiaGabonGambia, TheGeorgiaGermanyGhanaGreeceGrenadaGuatemalaGuineaGuinea-BissauGuyanaHaitiHeavily indebted poor countries (HIPC)High incomeHondurasHong Kong SAR, ChinaHungaryIBRD onlyIcelandIDA & IBRD totalIDA onlyIDA totalIndiaIndonesiaIran, Islamic Rep.IraqIrelandIsraelItalyJamaicaJapanJordanKazakhstanKenyaKiribatiKorea, Rep.KosovoKuwaitKyrgyz RepublicLao PDRLate-demographic dividendLatin America & Caribbean Latin America & Caribbean (excluding high income)Latin America & the Caribbean (IDA & IBRD countries)LatviaLeast developed countries: UN classificationLebanonLesothoLiberiaLibyaLithuaniaLow & middle incomeLow incomeLower middle incomeLuxembourgMacao SAR, ChinaMacedonia, FYRMadagascarMalawiMalaysiaMaldivesMaliMaltaMarshall IslandsMauritaniaMauritiusMexicoMicronesia, Fed. Sts.Middle East & North AfricaMiddle East & North Africa (excluding high income)Middle East & North Africa (IDA & IBRD countries)Middle incomeMoldovaMongoliaMontenegroMoroccoMozambiqueMyanmarNamibiaNepalNetherlandsNew CaledoniaNew ZealandNicaraguaNigerNigeriaNorth AmericaNorwayOECD membersOmanOther small statesPacific island small statesPakistanPalauPanamaPapua New GuineaParaguayPeruPhilippinesPolandPortugalPost-demographic dividendPre-demographic dividendQatarRomaniaRussian FederationRwandaSamoaSao Tome and PrincipeSaudi ArabiaSenegalSerbiaSeychellesSierra LeoneSingaporeSint Maarten (Dutch part)Slovak RepublicSloveniaSmall statesSolomon IslandsSouth AfricaSouth AsiaSouth Asia (IDA & IBRD)South SudanSpainSri LankaSt. Kitts and NevisSt. LuciaSt. Vincent and the GrenadinesSub-Saharan Africa Sub-Saharan Africa (excluding high income)Sub-Saharan Africa (IDA & IBRD countries)SudanSurinameSwazilandSwedenSwitzerlandSyrian Arab RepublicTajikistanTanzaniaThailandTimor-LesteTogoTongaTrinidad and TobagoTunisiaTurkeyTuvaluUgandaUkraineUnited KingdomUnited StatesUpper middle incomeUruguayVanuatuVenezuela, RBWest Bank and GazaWorldYemen, Rep.ZambiaZimbabwe Linha do tempo:
Nesta escala de tempo está apresentado um gráfico de 1977 ano até 2016 ano Poland. Dados de 1976 ano ausente. O número de observações reais por data: 40.
Fonte (nome):
Indicadores de desenvolvimento mundial
Fonte (organização):
International Monetary Fund, Balance of Payments Statistics Yearbook and data files.
Categorias:
Private Sector, Trade
Foi atualizado:
23 abr 2017 ano
Indicadores de alterações dos valores ao longo dos anos
Mínimo:
0.697
1 jan 1993 ano
Máximo:
18.676
1 jan 1999 ano
Na data de observação
Valor
Mudança absoluta
A alteração em relação ao valor anterior
1 jan 1977 ano
3.094
+3.094
0.0%
1 jan 1978 ano
2.659
-0.436
-14.09%
1 jan 1979 ano
2.354
-0.305
-11.47%
1 jan 1980 ano
2.26
-0.094
-3.99%
1 jan 1981 ano
2.017
-0.243
-10.75%
1 jan 1982 ano
1.789
-0.228
-11.28%
1 jan 1983 ano
2.495
+0.706
39.44%
1 jan 1984 ano
1.991
-0.504
-20.2%
1 jan 1985 ano
1.624
-0.367
-18.41%
1 jan 1986 ano
1.506
-0.118
-7.29%
1 jan 1987 ano
1.829
+0.323
21.45%
1 jan 1988 ano
1.568
-0.261
-14.27%
1 jan 1989 ano
1.568
+0.0
0.01%
1 jan 1990 ano
1.51
-0.058
-3.71%
1 jan 1991 ano
0.966
-0.544
-36.03%
1 jan 1992 ano
1.633
+0.667
69.09%
1 jan 1993 ano
0.697
-0.936
-57.32%
1 jan 1994 ano
1.033
+0.336
48.14%
1 jan 1995 ano
9.69
+8.658
838.28%
1 jan 1996 ano
13.627
+3.937
40.63%
1 jan 1997 ano
14.884
+1.257
9.22%
1 jan 1998 ano
18.324
+3.44
23.11%
1 jan 1999 ano
18.676
+0.351
1.92%
1 jan 2000 ano
13.91
-4.766
-25.52%
1 jan 2001 ano
6.093
-7.817
-56.2%
1 jan 2002 ano
8.121
+2.028
33.28%
1 jan 2003 ano
6.088
-2.032
-25.03%
1 jan 2004 ano
6.457
+0.369
6.05%
1 jan 2005 ano
4.048
-2.409
-37.31%
1 jan 2006 ano
5.058
+1.01
24.95%
1 jan 2007 ano
3.907
-1.151
-22.77%
1 jan 2008 ano
4.249
+0.343
8.77%
1 jan 2009 ano
4.863
+0.614
14.44%
1 jan 2010 ano
5.567
+0.704
14.49%
1 jan 2011 ano
7.181
+1.614
28.98%
1 jan 2012 ano
7.384
+0.203
2.82%
1 jan 2013 ano
6.917
-0.466
-6.32%
1 jan 2014 ano
5.525
-1.392
-20.12%
1 jan 2015 ano
5.574
+0.049
0.89%
1 jan 2016 ano
5.303
-0.272
-4.87%
Classificação de países por estatísticas atuais por anos


Comentários: