29
/pt/
pt
AIzaSyAYiBZKx7MnpbEhh9jyipgxe19OcubqV5w
April 1, 2024
227162
Qatar
QAT
true
2
1
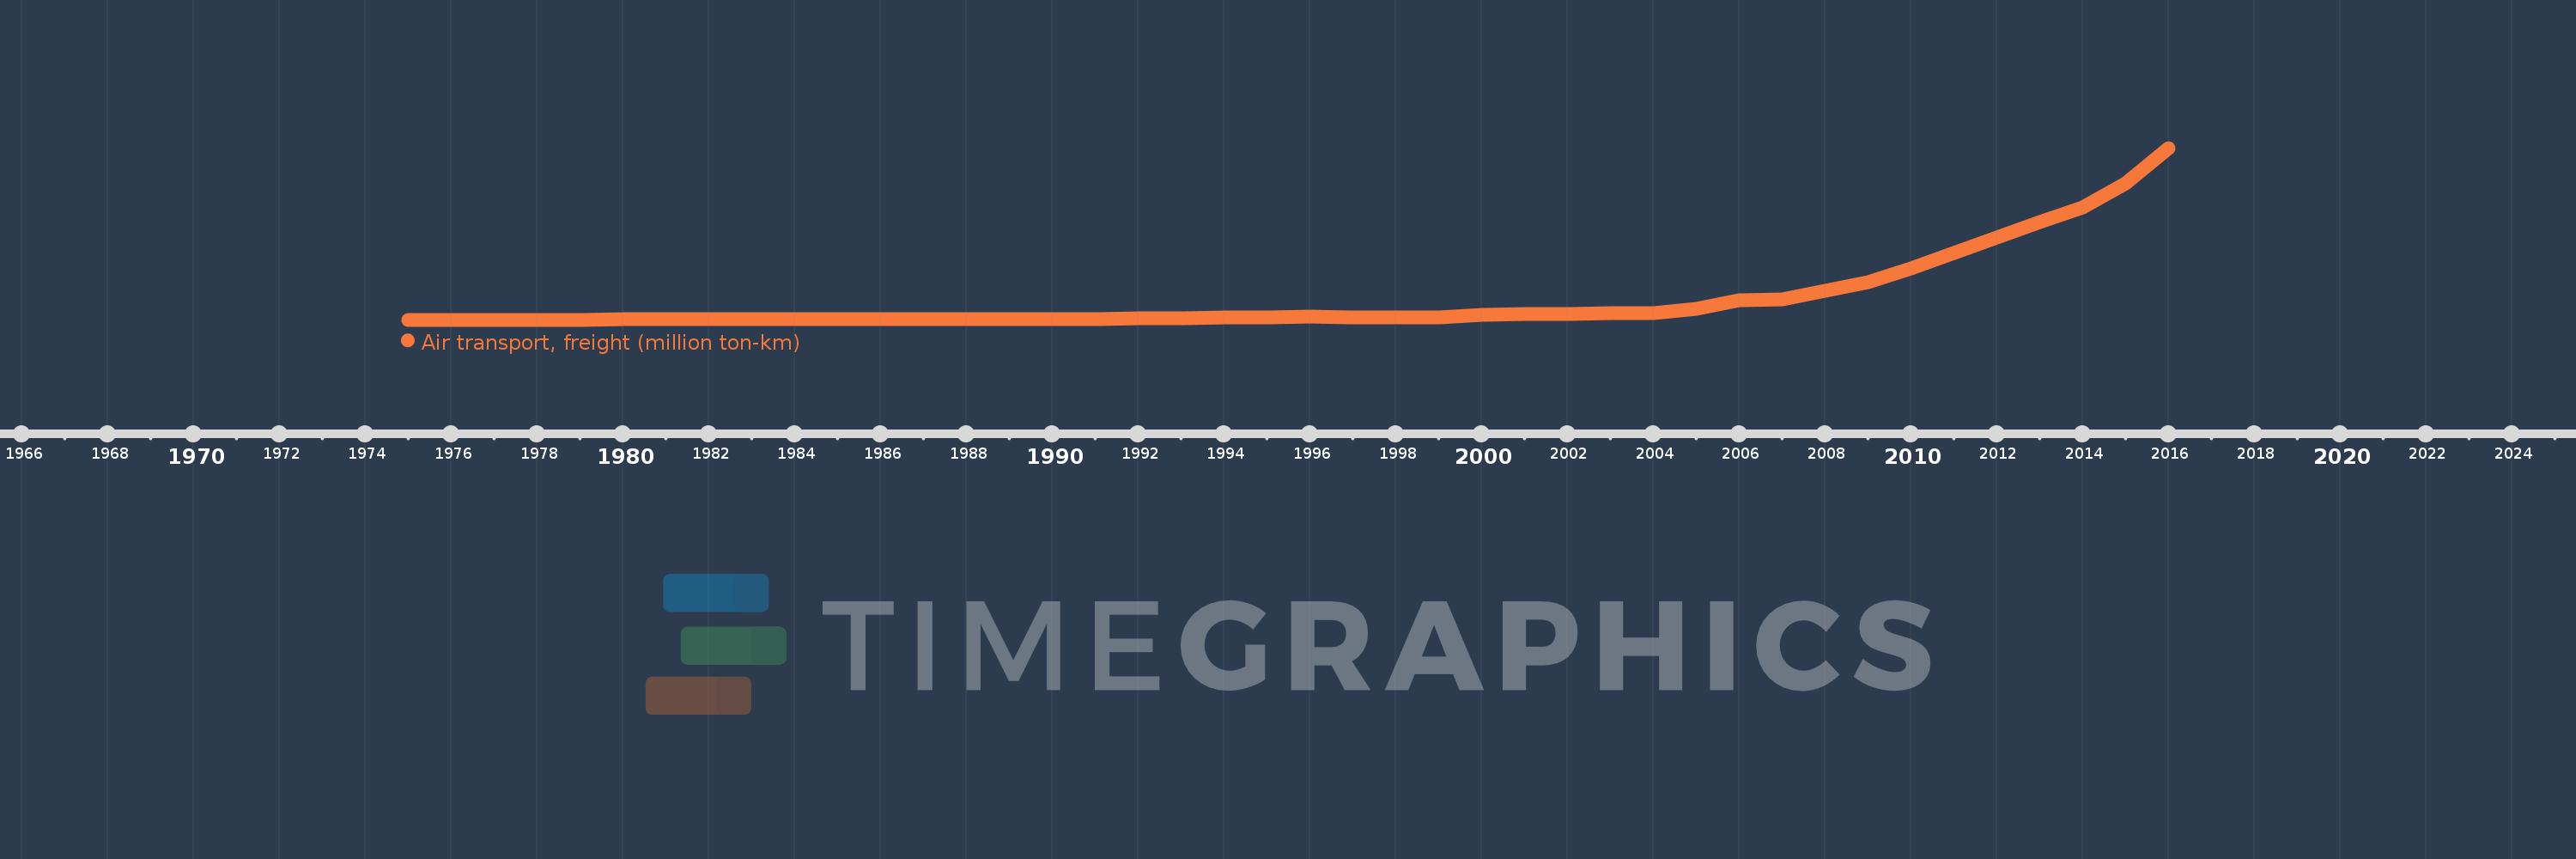
Air transport, freight (million ton-km)
2016,2015,2014,2013,2012,2011,2010,2009,2008,2007,2006,2005,2004,2003,2002,2001,2000,1999,1998,1997,1996,1995,1994,1993,1992,1991,1990,1989,1988,1987,1986,1985,1984,1983,1982,1981,1980,1979,1978,1977,1976,1975
Estas estatísticas em outros países:
AfghanistanAlbaniaAlgeriaAmerican SamoaAngolaAntigua and BarbudaArab WorldArgentinaArmeniaAustraliaAustriaAzerbaijanBahamas, TheBahrainBangladeshBarbadosBelarusBelgiumBelizeBeninBhutanBoliviaBosnia and HerzegovinaBotswanaBrazilBrunei DarussalamBulgariaBurkina FasoBurundiCabo VerdeCambodiaCameroonCanadaCaribbean small statesCentral African RepublicCentral Europe and the BalticsChadChileChinaColombiaComorosCongo, Dem. Rep.Congo, Rep.Costa RicaCote d'IvoireCroatiaCubaCyprusCzech RepublicDenmarkDjiboutiDominican RepublicEarly-demographic dividendEast Asia & PacificEast Asia & Pacific (excluding high income)East Asia & Pacific (IDA & IBRD countries)EcuadorEgypt, Arab Rep.El SalvadorEquatorial GuineaEritreaEstoniaEthiopiaEuro areaEurope & Central AsiaEurope & Central Asia (excluding high income)Europe & Central Asia (IDA & IBRD countries)European UnionFijiFinlandFragile and conflict affected situationsFranceGabonGambia, TheGeorgiaGermanyGhanaGreeceGuamGuatemalaGuineaGuinea-BissauGuyanaHaitiHeavily indebted poor countries (HIPC)High incomeHondurasHong Kong SAR, ChinaHungaryIBRD onlyIcelandIDA & IBRD totalIDA blendIDA onlyIDA totalIndiaIndonesiaIran, Islamic Rep.IraqIrelandIsraelItalyJamaicaJapanJordanKazakhstanKenyaKiribatiKorea, Dem. People’s Rep.Korea, Rep.KuwaitKyrgyz RepublicLao PDRLate-demographic dividendLatin America & Caribbean Latin America & Caribbean (excluding high income)Latin America & the Caribbean (IDA & IBRD countries)LatviaLeast developed countries: UN classificationLebanonLesothoLiberiaLibyaLithuaniaLow & middle incomeLow incomeLower middle incomeLuxembourgMacao SAR, ChinaMacedonia, FYRMadagascarMalawiMalaysiaMaldivesMaliMaltaMarshall IslandsMauritaniaMauritiusMexicoMiddle East & North AfricaMiddle East & North Africa (excluding high income)Middle East & North Africa (IDA & IBRD countries)Middle incomeMoldovaMonacoMongoliaMontenegroMoroccoMozambiqueMyanmarNamibiaNauruNepalNetherlandsNew ZealandNicaraguaNigerNigeriaNorth AmericaNorwayOECD membersOmanOther small statesPacific island small statesPakistanPanamaPapua New GuineaParaguayPeruPhilippinesPolandPortugalPost-demographic dividendPre-demographic dividendQatarRomaniaRussian FederationRwandaSamoaSao Tome and PrincipeSaudi ArabiaSenegalSerbiaSeychellesSierra LeoneSingaporeSlovak RepublicSloveniaSmall statesSolomon IslandsSomaliaSouth AfricaSouth AsiaSouth Asia (IDA & IBRD)SpainSri LankaSub-Saharan Africa Sub-Saharan Africa (excluding high income)Sub-Saharan Africa (IDA & IBRD countries)SudanSurinameSwazilandSwedenSwitzerlandSyrian Arab RepublicTajikistanTanzaniaThailandTogoTongaTrinidad and TobagoTunisiaTurkeyTurkmenistanUgandaUkraineUnited Arab EmiratesUnited KingdomUnited StatesUpper middle incomeUruguayUzbekistanVanuatuVenezuela, RBVietnamWorldYemen, Rep.ZambiaZimbabwe Linha do tempo:
Nesta escala de tempo está apresentado um gráfico de 1975 ano até 2016 ano Qatar. Dados de 1974 ano ausente. O número de observações reais por data: 42.
Fonte (nome):
Indicadores de desenvolvimento mundial
Fonte (organização):
International Civil Aviation Organization, Civil Aviation Statistics of the World and ICAO staff estimates.
Categorias:
Infrastructure
Foi atualizado:
23 abr 2017 ano
Indicadores de alterações dos valores ao longo dos anos
Máximo:
7.563 mil
1 jan 2016 ano
Na data de observação
Valor
Mudança absoluta
A alteração em relação ao valor anterior
1 jan 1975 ano
2.2
+2.2
0.0%
1 jan 1976 ano
4.0
+1.8
81.82%
1 jan 1977 ano
6.8
+2.8
70.0%
1 jan 1978 ano
8.2
+1.4
20.59%
1 jan 1979 ano
9.6
+1.4
17.07%
1 jan 1980 ano
14.0
+4.4
45.83%
1 jan 1981 ano
26.2
+12.2
87.14%
1 jan 1982 ano
21.4
-4.8
-18.32%
1 jan 1983 ano
21.6
+0.2
0.93%
1 jan 1984 ano
23.8
+2.2
10.19%
1 jan 1985 ano
30.7
+6.9
28.99%
1 jan 1986 ano
32.6
+1.9
6.19%
1 jan 1987 ano
31.4
-1.2
-3.68%
1 jan 1988 ano
31.5
+0.1
0.32%
1 jan 1989 ano
33.9
+2.4
7.62%
1 jan 1990 ano
40.0
+6.1
17.99%
1 jan 1991 ano
44.3
+4.3
10.75%
1 jan 1992 ano
51.2
+6.9
15.58%
1 jan 1993 ano
69.8
+18.6
36.33%
1 jan 1994 ano
88.1
+18.3
26.22%
1 jan 1995 ano
122.1
+34.0
38.59%
1 jan 1996 ano
132.8
+10.7
8.76%
1 jan 1997 ano
105.8
-27.0
-20.33%
1 jan 1998 ano
96.6
-9.2
-8.7%
1 jan 1999 ano
104.5
+7.9
8.18%
1 jan 2000 ano
206.7
+102.2
97.8%
1 jan 2001 ano
244.07
+37.37
18.08%
1 jan 2002 ano
256.817
+12.747
5.22%
1 jan 2003 ano
305.484
+48.667
18.95%
1 jan 2004 ano
276.42
-29.064
-9.51%
1 jan 2005 ano
469.19
+192.77
69.74%
1 jan 2006 ano
869.582
+400.392
85.34%
1 jan 2007 ano
888.498
+18.916
2.18%
1 jan 2008 ano
1.293 mil
+404.248
45.5%
1 jan 2009 ano
1.639 mil
+346.4
26.8%
1 jan 2010 ano
2.276 mil
+637.232
38.88%
1 jan 2011 ano
2.946 mil
+669.409
29.41%
1 jan 2012 ano
3.637 mil
+691.344
23.47%
1 jan 2013 ano
4.307 mil
+669.791
18.42%
1 jan 2014 ano
4.961 mil
+653.66
15.18%
1 jan 2015 ano
5.993 mil
+1.033 mil
20.81%
1 jan 2016 ano
7.563 mil
+1.57 mil
26.2%
Classificação de países por estatísticas atuais por anos


Comentários: