29
/pt/
pt
AIzaSyAYiBZKx7MnpbEhh9jyipgxe19OcubqV5w
April 1, 2024
173786
Lao PDR
LAO
true
2
1
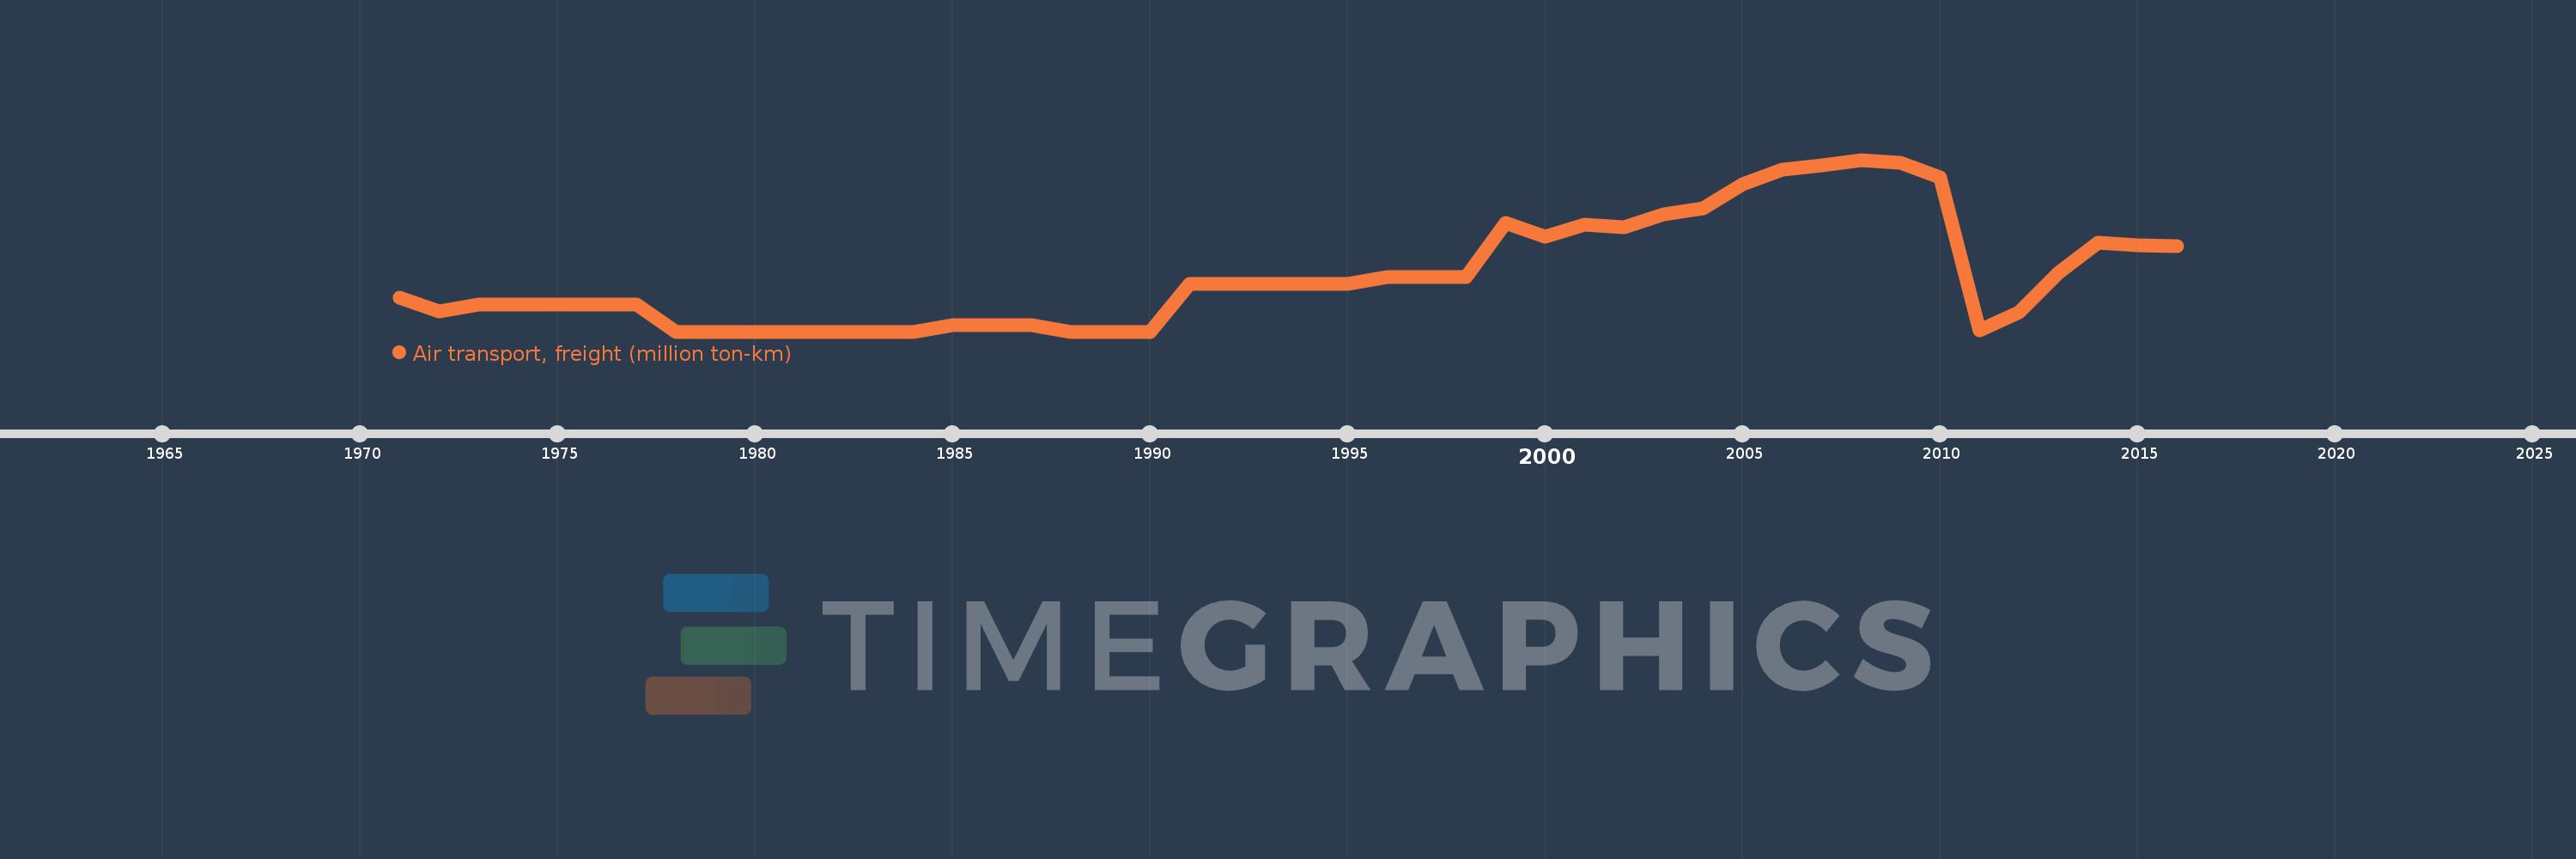
Air transport, freight (million ton-km)
2016,2015,2014,2013,2012,2011,2010,2009,2008,2007,2006,2005,2004,2003,2002,2001,2000,1999,1998,1997,1996,1995,1994,1993,1992,1991,1990,1989,1988,1987,1986,1985,1984,1983,1982,1981,1980,1979,1978,1977,1976,1975,1974,1973,1972,1971
Estas estatísticas em outros países:
AfghanistanAlbaniaAlgeriaAmerican SamoaAngolaAntigua and BarbudaArab WorldArgentinaArmeniaAustraliaAustriaAzerbaijanBahamas, TheBahrainBangladeshBarbadosBelarusBelgiumBelizeBeninBhutanBoliviaBosnia and HerzegovinaBotswanaBrazilBrunei DarussalamBulgariaBurkina FasoBurundiCabo VerdeCambodiaCameroonCanadaCaribbean small statesCentral African RepublicCentral Europe and the BalticsChadChileChinaColombiaComorosCongo, Dem. Rep.Congo, Rep.Costa RicaCote d'IvoireCroatiaCubaCyprusCzech RepublicDenmarkDjiboutiDominican RepublicEarly-demographic dividendEast Asia & PacificEast Asia & Pacific (excluding high income)East Asia & Pacific (IDA & IBRD countries)EcuadorEgypt, Arab Rep.El SalvadorEquatorial GuineaEritreaEstoniaEthiopiaEuro areaEurope & Central AsiaEurope & Central Asia (excluding high income)Europe & Central Asia (IDA & IBRD countries)European UnionFijiFinlandFragile and conflict affected situationsFranceGabonGambia, TheGeorgiaGermanyGhanaGreeceGuamGuatemalaGuineaGuinea-BissauGuyanaHaitiHeavily indebted poor countries (HIPC)High incomeHondurasHong Kong SAR, ChinaHungaryIBRD onlyIcelandIDA & IBRD totalIDA blendIDA onlyIDA totalIndiaIndonesiaIran, Islamic Rep.IraqIrelandIsraelItalyJamaicaJapanJordanKazakhstanKenyaKiribatiKorea, Dem. People’s Rep.Korea, Rep.KuwaitKyrgyz RepublicLao PDRLate-demographic dividendLatin America & Caribbean Latin America & Caribbean (excluding high income)Latin America & the Caribbean (IDA & IBRD countries)LatviaLeast developed countries: UN classificationLebanonLesothoLiberiaLibyaLithuaniaLow & middle incomeLow incomeLower middle incomeLuxembourgMacao SAR, ChinaMacedonia, FYRMadagascarMalawiMalaysiaMaldivesMaliMaltaMarshall IslandsMauritaniaMauritiusMexicoMiddle East & North AfricaMiddle East & North Africa (excluding high income)Middle East & North Africa (IDA & IBRD countries)Middle incomeMoldovaMonacoMongoliaMontenegroMoroccoMozambiqueMyanmarNamibiaNauruNepalNetherlandsNew ZealandNicaraguaNigerNigeriaNorth AmericaNorwayOECD membersOmanOther small statesPacific island small statesPakistanPanamaPapua New GuineaParaguayPeruPhilippinesPolandPortugalPost-demographic dividendPre-demographic dividendQatarRomaniaRussian FederationRwandaSamoaSao Tome and PrincipeSaudi ArabiaSenegalSerbiaSeychellesSierra LeoneSingaporeSlovak RepublicSloveniaSmall statesSolomon IslandsSomaliaSouth AfricaSouth AsiaSouth Asia (IDA & IBRD)SpainSri LankaSub-Saharan Africa Sub-Saharan Africa (excluding high income)Sub-Saharan Africa (IDA & IBRD countries)SudanSurinameSwazilandSwedenSwitzerlandSyrian Arab RepublicTajikistanTanzaniaThailandTogoTongaTrinidad and TobagoTunisiaTurkeyTurkmenistanUgandaUkraineUnited Arab EmiratesUnited KingdomUnited StatesUpper middle incomeUruguayUzbekistanVanuatuVenezuela, RBVietnamWorldYemen, Rep.ZambiaZimbabwe Linha do tempo:
Nesta escala de tempo está apresentado um gráfico de 1971 ano até 2016 ano Lao PDR. Dados de 1970 ano ausente. O número de observações reais por data: 46.
Fonte (nome):
Indicadores de desenvolvimento mundial
Fonte (organização):
International Civil Aviation Organization, Civil Aviation Statistics of the World and ICAO staff estimates.
Categorias:
Infrastructure
Foi atualizado:
23 abr 2017 ano
Indicadores de alterações dos valores ao longo dos anos
Máximo:
2.625
1 jan 2008 ano
Na data de observação
Valor
Mudança absoluta
A alteração em relação ao valor anterior
1 jan 1971 ano
0.6
+0.6
0.0%
1 jan 1972 ano
0.4
-0.2
-33.33%
1 jan 1973 ano
0.5
+0.1
25.0%
1 jan 1974 ano
0.5
0.0
0.0%
1 jan 1975 ano
0.5
0.0
0.0%
1 jan 1976 ano
0.5
0.0
0.0%
1 jan 1977 ano
0.5
0.0
0.0%
1 jan 1978 ano
0.1
-0.4
-80.0%
1 jan 1979 ano
0.1
0.0
0.0%
1 jan 1980 ano
0.1
0.0
0.0%
1 jan 1981 ano
0.1
0.0
0.0%
1 jan 1982 ano
0.1
0.0
0.0%
1 jan 1983 ano
0.1
0.0
0.0%
1 jan 1984 ano
0.1
0.0
0.0%
1 jan 1985 ano
0.2
+0.1
100.0%
1 jan 1986 ano
0.2
0.0
0.0%
1 jan 1987 ano
0.2
0.0
0.0%
1 jan 1988 ano
0.1
-0.1
-50.0%
1 jan 1989 ano
0.1
0.0
0.0%
1 jan 1990 ano
0.1
0.0
0.0%
1 jan 1991 ano
0.8
+0.7
700.0%
1 jan 1992 ano
0.8
0.0
0.0%
1 jan 1993 ano
0.8
0.0
0.0%
1 jan 1994 ano
0.8
0.0
0.0%
1 jan 1995 ano
0.8
0.0
0.0%
1 jan 1996 ano
0.9
+0.1
12.5%
1 jan 1997 ano
0.9
0.0
0.0%
1 jan 1998 ano
0.9
0.0
0.0%
1 jan 1999 ano
1.7
+0.8
88.89%
1 jan 2000 ano
1.5
-0.2
-11.76%
1 jan 2001 ano
1.671
+0.171
11.4%
1 jan 2002 ano
1.64
-0.031
-1.86%
1 jan 2003 ano
1.828
+0.188
11.46%
1 jan 2004 ano
1.911
+0.083
4.54%
1 jan 2005 ano
2.261
+0.35
18.32%
1 jan 2006 ano
2.481
+0.22
9.73%
1 jan 2007 ano
2.545
+0.064
2.58%
1 jan 2008 ano
2.625
+0.08
3.14%
1 jan 2009 ano
2.579
-0.046
-1.75%
1 jan 2010 ano
2.367
-0.212
-8.22%
1 jan 2011 ano
0.122
-2.245
-94.85%
1 jan 2012 ano
0.389
+0.267
218.85%
1 jan 2013 ano
0.966
+0.577
148.45%
1 jan 2014 ano
1.41
+0.443
45.87%
1 jan 2015 ano
1.372
-0.038
-2.69%
1 jan 2016 ano
1.356
-0.015
-1.13%
Classificação de países por estatísticas atuais por anos


Comentários: