29
/pt/
pt
AIzaSyAYiBZKx7MnpbEhh9jyipgxe19OcubqV5w
April 1, 2024
154225
India
IND
true
2
1
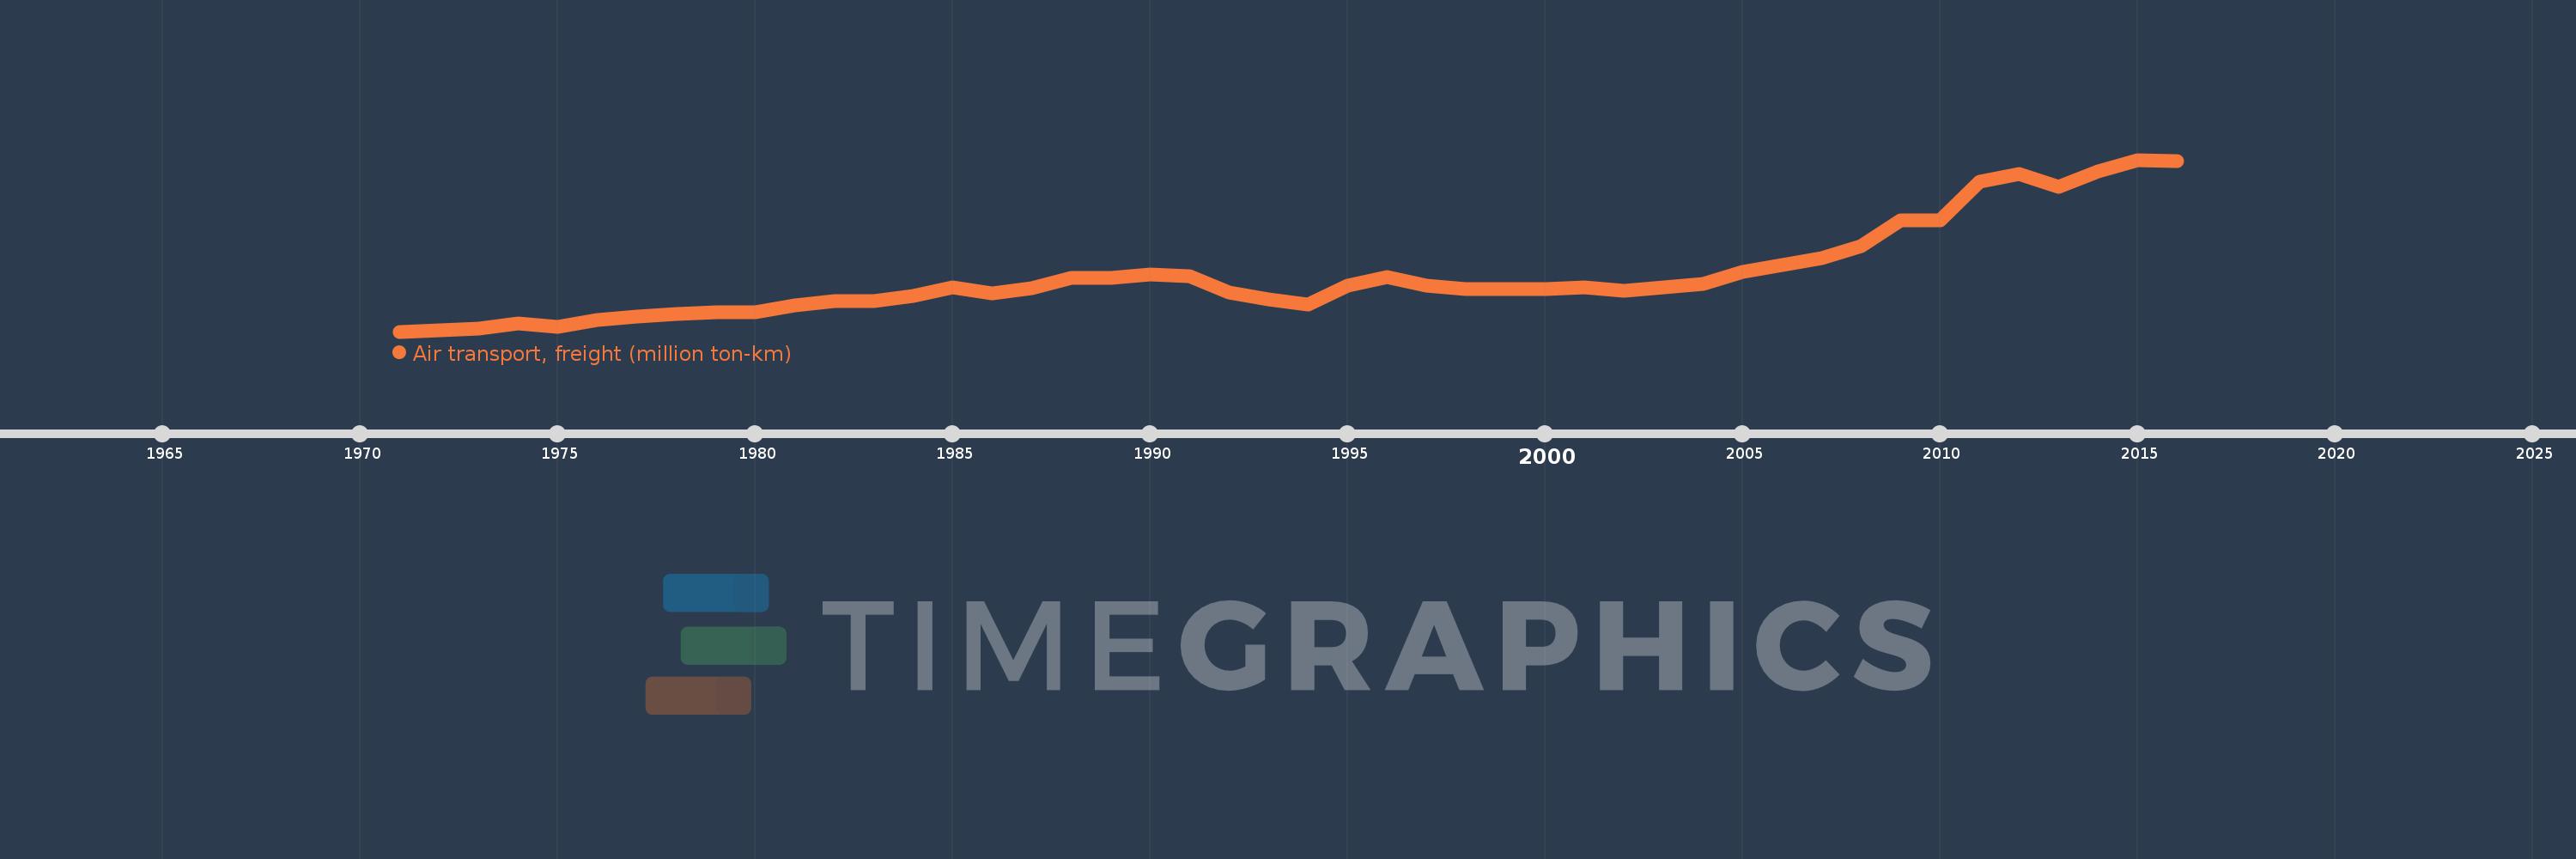
Air transport, freight (million ton-km)
2016,2015,2014,2013,2012,2011,2010,2009,2008,2007,2006,2005,2004,2003,2002,2001,2000,1999,1998,1997,1996,1995,1994,1993,1992,1991,1990,1989,1988,1987,1986,1985,1984,1983,1982,1981,1980,1979,1978,1977,1976,1975,1974,1973,1972,1971
Estas estatísticas em outros países:
AfghanistanAlbaniaAlgeriaAmerican SamoaAngolaAntigua and BarbudaArab WorldArgentinaArmeniaAustraliaAustriaAzerbaijanBahamas, TheBahrainBangladeshBarbadosBelarusBelgiumBelizeBeninBhutanBoliviaBosnia and HerzegovinaBotswanaBrazilBrunei DarussalamBulgariaBurkina FasoBurundiCabo VerdeCambodiaCameroonCanadaCaribbean small statesCentral African RepublicCentral Europe and the BalticsChadChileChinaColombiaComorosCongo, Dem. Rep.Congo, Rep.Costa RicaCote d'IvoireCroatiaCubaCyprusCzech RepublicDenmarkDjiboutiDominican RepublicEarly-demographic dividendEast Asia & PacificEast Asia & Pacific (excluding high income)East Asia & Pacific (IDA & IBRD countries)EcuadorEgypt, Arab Rep.El SalvadorEquatorial GuineaEritreaEstoniaEthiopiaEuro areaEurope & Central AsiaEurope & Central Asia (excluding high income)Europe & Central Asia (IDA & IBRD countries)European UnionFijiFinlandFragile and conflict affected situationsFranceGabonGambia, TheGeorgiaGermanyGhanaGreeceGuamGuatemalaGuineaGuinea-BissauGuyanaHaitiHeavily indebted poor countries (HIPC)High incomeHondurasHong Kong SAR, ChinaHungaryIBRD onlyIcelandIDA & IBRD totalIDA blendIDA onlyIDA totalIndiaIndonesiaIran, Islamic Rep.IraqIrelandIsraelItalyJamaicaJapanJordanKazakhstanKenyaKiribatiKorea, Dem. People’s Rep.Korea, Rep.KuwaitKyrgyz RepublicLao PDRLate-demographic dividendLatin America & Caribbean Latin America & Caribbean (excluding high income)Latin America & the Caribbean (IDA & IBRD countries)LatviaLeast developed countries: UN classificationLebanonLesothoLiberiaLibyaLithuaniaLow & middle incomeLow incomeLower middle incomeLuxembourgMacao SAR, ChinaMacedonia, FYRMadagascarMalawiMalaysiaMaldivesMaliMaltaMarshall IslandsMauritaniaMauritiusMexicoMiddle East & North AfricaMiddle East & North Africa (excluding high income)Middle East & North Africa (IDA & IBRD countries)Middle incomeMoldovaMonacoMongoliaMontenegroMoroccoMozambiqueMyanmarNamibiaNauruNepalNetherlandsNew ZealandNicaraguaNigerNigeriaNorth AmericaNorwayOECD membersOmanOther small statesPacific island small statesPakistanPanamaPapua New GuineaParaguayPeruPhilippinesPolandPortugalPost-demographic dividendPre-demographic dividendQatarRomaniaRussian FederationRwandaSamoaSao Tome and PrincipeSaudi ArabiaSenegalSerbiaSeychellesSierra LeoneSingaporeSlovak RepublicSloveniaSmall statesSolomon IslandsSomaliaSouth AfricaSouth AsiaSouth Asia (IDA & IBRD)SpainSri LankaSub-Saharan Africa Sub-Saharan Africa (excluding high income)Sub-Saharan Africa (IDA & IBRD countries)SudanSurinameSwazilandSwedenSwitzerlandSyrian Arab RepublicTajikistanTanzaniaThailandTogoTongaTrinidad and TobagoTunisiaTurkeyTurkmenistanUgandaUkraineUnited Arab EmiratesUnited KingdomUnited StatesUpper middle incomeUruguayUzbekistanVanuatuVenezuela, RBVietnamWorldYemen, Rep.ZambiaZimbabwe Linha do tempo:
Nesta escala de tempo está apresentado um gráfico de 1971 ano até 2016 ano India. Dados de 1970 ano ausente. O número de observações reais por data: 46.
Fonte (nome):
Indicadores de desenvolvimento mundial
Fonte (organização):
International Civil Aviation Organization, Civil Aviation Statistics of the World and ICAO staff estimates.
Categorias:
Infrastructure
Foi atualizado:
23 abr 2017 ano
Indicadores de alterações dos valores ao longo dos anos
Mínimo:
96.3
1 jan 1971 ano
Máximo:
1.851 mil
1 jan 2015 ano
Na data de observação
Valor
Mudança absoluta
A alteração em relação ao valor anterior
1 jan 1971 ano
96.3
+96.3
0.0%
1 jan 1972 ano
108.4
+12.1
12.56%
1 jan 1973 ano
131.1
+22.7
20.94%
1 jan 1974 ano
176.5
+45.4
34.63%
1 jan 1975 ano
144.7
-31.8
-18.02%
1 jan 1976 ano
211.3
+66.6
46.03%
1 jan 1977 ano
250.7
+39.4
18.65%
1 jan 1978 ano
275.9
+25.2
10.05%
1 jan 1979 ano
297.7
+21.8
7.9%
1 jan 1980 ano
297.6
-0.1
-0.03%
1 jan 1981 ano
366.0
+68.4
22.98%
1 jan 1982 ano
411.4
+45.4
12.4%
1 jan 1983 ano
409.9
-1.5
-0.36%
1 jan 1984 ano
461.6
+51.7
12.61%
1 jan 1985 ano
545.5
+83.9
18.18%
1 jan 1986 ano
489.7
-55.8
-10.23%
1 jan 1987 ano
539.7
+50.0
10.21%
1 jan 1988 ano
645.2
+105.5
19.55%
1 jan 1989 ano
646.3
+1.1
0.17%
1 jan 1990 ano
680.6
+34.3
5.31%
1 jan 1991 ano
662.9
-17.7
-2.6%
1 jan 1992 ano
493.1
-169.8
-25.61%
1 jan 1993 ano
429.4
-63.7
-12.92%
1 jan 1994 ano
372.4
-57.0
-13.27%
1 jan 1995 ano
563.6
+191.2
51.34%
1 jan 1996 ano
653.9
+90.3
16.02%
1 jan 1997 ano
565.0
-88.9
-13.6%
1 jan 1998 ano
528.0
-37.0
-6.55%
1 jan 1999 ano
531.3
+3.3
0.62%
1 jan 2000 ano
531.2
-0.1
-0.02%
1 jan 2001 ano
547.652
+16.452
3.1%
1 jan 2002 ano
515.37
-32.282
-5.89%
1 jan 2003 ano
546.34
+30.97
6.01%
1 jan 2004 ano
579.85
+33.51
6.13%
1 jan 2005 ano
708.475
+128.625
22.18%
1 jan 2006 ano
774.04
+65.565
9.25%
1 jan 2007 ano
842.55
+68.51
8.85%
1 jan 2008 ano
967.684
+125.134
14.85%
1 jan 2009 ano
1.234 mil
+266.253
27.51%
1 jan 2010 ano
1.235 mil
+1.221
0.1%
1 jan 2011 ano
1.631 mil
+395.806
32.04%
1 jan 2012 ano
1.703 mil
+71.739
4.4%
1 jan 2013 ano
1.579 mil
-123.473
-7.25%
1 jan 2014 ano
1.734 mil
+154.532
9.79%
1 jan 2015 ano
1.851 mil
+117.565
6.78%
1 jan 2016 ano
1.834 mil
-17.479
-0.94%
Classificação de países por estatísticas atuais por anos


Comentários: