29
/pt/
pt
AIzaSyAYiBZKx7MnpbEhh9jyipgxe19OcubqV5w
April 1, 2024
194526
Mauritius
MUS
true
2
1
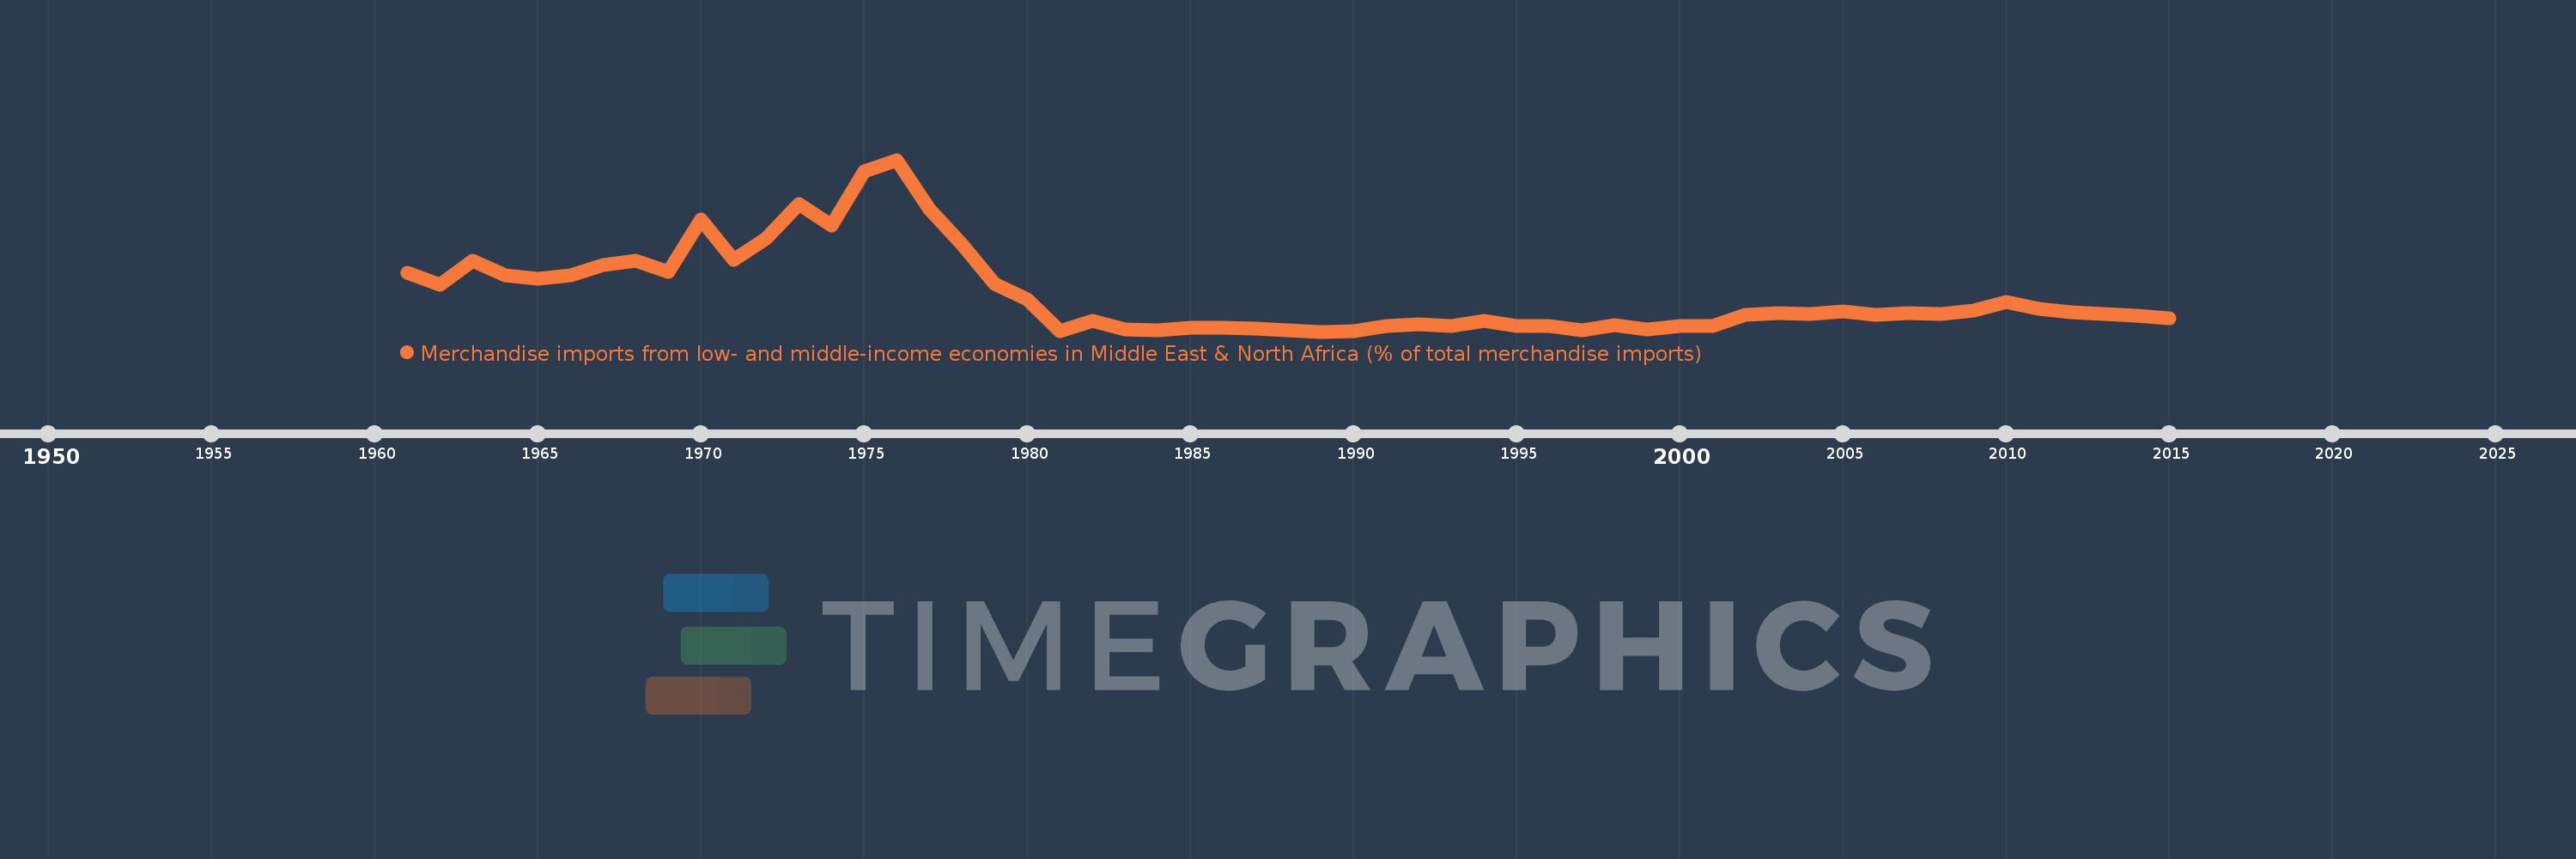
Merchandise imports from low- and middle-income economies in Middle East & North Africa (% of total merchandise imports)
2015,2014,2013,2012,2011,2010,2009,2008,2007,2006,2005,2004,2003,2002,2001,2000,1999,1998,1997,1996,1995,1994,1993,1992,1991,1990,1989,1988,1987,1986,1985,1984,1983,1982,1981,1980,1979,1978,1977,1976,1975,1974,1973,1972,1971,1970,1969,1968,1967,1966,1965,1964,1963,1962,1961
Estas estatísticas em outros países:
AfghanistanAlbaniaAlgeriaAngolaArab WorldArgentinaArmeniaArubaAustraliaAustriaAzerbaijanBahamas, TheBahrainBangladeshBarbadosBelarusBelgiumBelizeBeninBermudaBoliviaBosnia and HerzegovinaBrazilBrunei DarussalamBulgariaBurkina FasoBurundiCabo VerdeCambodiaCameroonCanadaCaribbean small statesCentral African RepublicCentral Europe and the BalticsChadChileChinaColombiaComorosCongo, Dem. Rep.Congo, Rep.Costa RicaCote d'IvoireCroatiaCubaCyprusCzech RepublicDenmarkDjiboutiDominicaDominican RepublicEarly-demographic dividendEast Asia & PacificEast Asia & Pacific (excluding high income)East Asia & Pacific (IDA & IBRD countries)EcuadorEgypt, Arab Rep.El SalvadorEstoniaEthiopiaEuro areaEurope & Central AsiaEurope & Central Asia (excluding high income)Europe & Central Asia (IDA & IBRD countries)European UnionFijiFinlandFragile and conflict affected situationsFranceFrench PolynesiaGabonGambia, TheGeorgiaGermanyGhanaGreeceGreenlandGrenadaGuatemalaGuineaGuinea-BissauGuyanaHaitiHeavily indebted poor countries (HIPC)High incomeHondurasHong Kong SAR, ChinaHungaryIBRD onlyIcelandIDA & IBRD totalIDA blendIDA onlyIDA totalIndiaIndonesiaIran, Islamic Rep.IraqIrelandIsraelItalyJamaicaJapanJordanKazakhstanKenyaKorea, Dem. People’s Rep.Korea, Rep.KosovoKuwaitKyrgyz RepublicLao PDRLate-demographic dividendLatin America & Caribbean Latin America & Caribbean (excluding high income)Latin America & the Caribbean (IDA & IBRD countries)LatviaLeast developed countries: UN classificationLebanonLiberiaLibyaLithuaniaLow & middle incomeLow incomeLower middle incomeLuxembourgMacao SAR, ChinaMacedonia, FYRMadagascarMalawiMalaysiaMaldivesMaliMaltaMauritaniaMauritiusMexicoMiddle East & North AfricaMiddle East & North Africa (excluding high income)Middle East & North Africa (IDA & IBRD countries)Middle incomeMoldovaMongoliaMontenegroMoroccoMozambiqueMyanmarNepalNetherlandsNew CaledoniaNew ZealandNicaraguaNigerNigeriaNorth AmericaNorwayOECD membersOmanOther small statesPacific island small statesPakistanPanamaPapua New GuineaParaguayPeruPhilippinesPolandPortugalPost-demographic dividendPre-demographic dividendQatarRomaniaRussian FederationRwandaSamoaSaudi ArabiaSenegalSerbiaSeychellesSierra LeoneSingaporeSlovak RepublicSloveniaSmall statesSomaliaSouth AfricaSouth AsiaSouth Asia (IDA & IBRD)SpainSri LankaSt. Kitts and NevisSt. LuciaSt. Vincent and the GrenadinesSub-Saharan Africa Sub-Saharan Africa (excluding high income)Sub-Saharan Africa (IDA & IBRD countries)SudanSurinameSwedenSwitzerlandSyrian Arab RepublicTajikistanTanzaniaThailandTogoTrinidad and TobagoTunisiaTurkeyTurkmenistanUgandaUkraineUnited Arab EmiratesUnited KingdomUnited StatesUpper middle incomeUruguayUzbekistanVenezuela, RBVietnamWorldYemen, Rep.ZambiaZimbabwe Linha do tempo:
Nesta escala de tempo está apresentado um gráfico de 1961 ano até 2015 ano Mauritius. Dados de 1960 ano ausente. O número de observações reais por data: 55.
Fonte (nome):
Indicadores de desenvolvimento mundial
Fonte (organização):
World Bank staff estimates based data from International Monetary Fund's Direction of Trade database.
Categorias:
Private Sector, Trade
Foi atualizado:
23 abr 2017 ano
Indicadores de alterações dos valores ao longo dos anos
Mínimo:
0.115
1 jan 1989 ano
Máximo:
9.152
1 jan 1976 ano
Na data de observação
Valor
Mudança absoluta
A alteração em relação ao valor anterior
1 jan 1961 ano
3.216
+3.216
0.0%
1 jan 1962 ano
2.58
-0.637
-19.8%
1 jan 1963 ano
3.828
+1.249
48.41%
1 jan 1964 ano
3.084
-0.745
-19.45%
1 jan 1965 ano
2.882
-0.201
-6.53%
1 jan 1966 ano
3.067
+0.184
6.4%
1 jan 1967 ano
3.628
+0.562
18.32%
1 jan 1968 ano
3.841
+0.213
5.86%
1 jan 1969 ano
3.276
-0.565
-14.7%
1 jan 1970 ano
6.006
+2.73
83.31%
1 jan 1971 ano
3.876
-2.13
-35.46%
1 jan 1972 ano
5.02
+1.144
29.5%
1 jan 1973 ano
6.813
+1.794
35.73%
1 jan 1974 ano
5.674
-1.139
-16.72%
1 jan 1975 ano
8.526
+2.852
50.26%
1 jan 1976 ano
9.152
+0.626
7.35%
1 jan 1977 ano
6.573
-2.579
-28.18%
1 jan 1978 ano
4.694
-1.879
-28.59%
1 jan 1979 ano
2.623
-2.071
-44.12%
1 jan 1980 ano
1.83
-0.793
-30.22%
1 jan 1981 ano
0.121
-1.709
-93.39%
1 jan 1982 ano
0.683
+0.562
465.19%
1 jan 1983 ano
0.223
-0.46
-67.31%
1 jan 1984 ano
0.169
-0.054
-24.18%
1 jan 1985 ano
0.313
+0.144
84.81%
1 jan 1986 ano
0.34
+0.027
8.72%
1 jan 1987 ano
0.255
-0.086
-25.21%
1 jan 1988 ano
0.165
-0.09
-35.24%
1 jan 1989 ano
0.115
-0.05
-30.44%
1 jan 1990 ano
0.129
+0.014
12.35%
1 jan 1991 ano
0.418
+0.289
224.34%
1 jan 1992 ano
0.513
+0.095
22.77%
1 jan 1993 ano
0.392
-0.121
-23.63%
1 jan 1994 ano
0.699
+0.308
78.55%
1 jan 1995 ano
0.405
-0.294
-42.03%
1 jan 1996 ano
0.399
-0.007
-1.6%
1 jan 1997 ano
0.19
-0.209
-52.49%
1 jan 1998 ano
0.432
+0.242
127.79%
1 jan 1999 ano
0.21
-0.222
-51.41%
1 jan 2000 ano
0.388
+0.178
85.02%
1 jan 2001 ano
0.396
+0.008
1.95%
1 jan 2002 ano
0.991
+0.595
150.37%
1 jan 2003 ano
1.084
+0.094
9.44%
1 jan 2004 ano
1.056
-0.029
-2.64%
1 jan 2005 ano
1.171
+0.115
10.88%
1 jan 2006 ano
0.994
-0.177
-15.1%
1 jan 2007 ano
1.076
+0.083
8.31%
1 jan 2008 ano
1.022
-0.055
-5.07%
1 jan 2009 ano
1.206
+0.185
18.06%
1 jan 2010 ano
1.668
+0.462
38.3%
1 jan 2011 ano
1.331
-0.337
-20.19%
1 jan 2012 ano
1.118
-0.214
-16.06%
1 jan 2013 ano
1.06
-0.058
-5.19%
1 jan 2014 ano
0.952
-0.107
-10.12%
1 jan 2015 ano
0.817
-0.135
-14.17%
Classificação de países por estatísticas atuais por anos


Comentários: