29
/pt/
pt
AIzaSyAYiBZKx7MnpbEhh9jyipgxe19OcubqV5w
April 1, 2024
101347
Canada
CAN
true
2
1
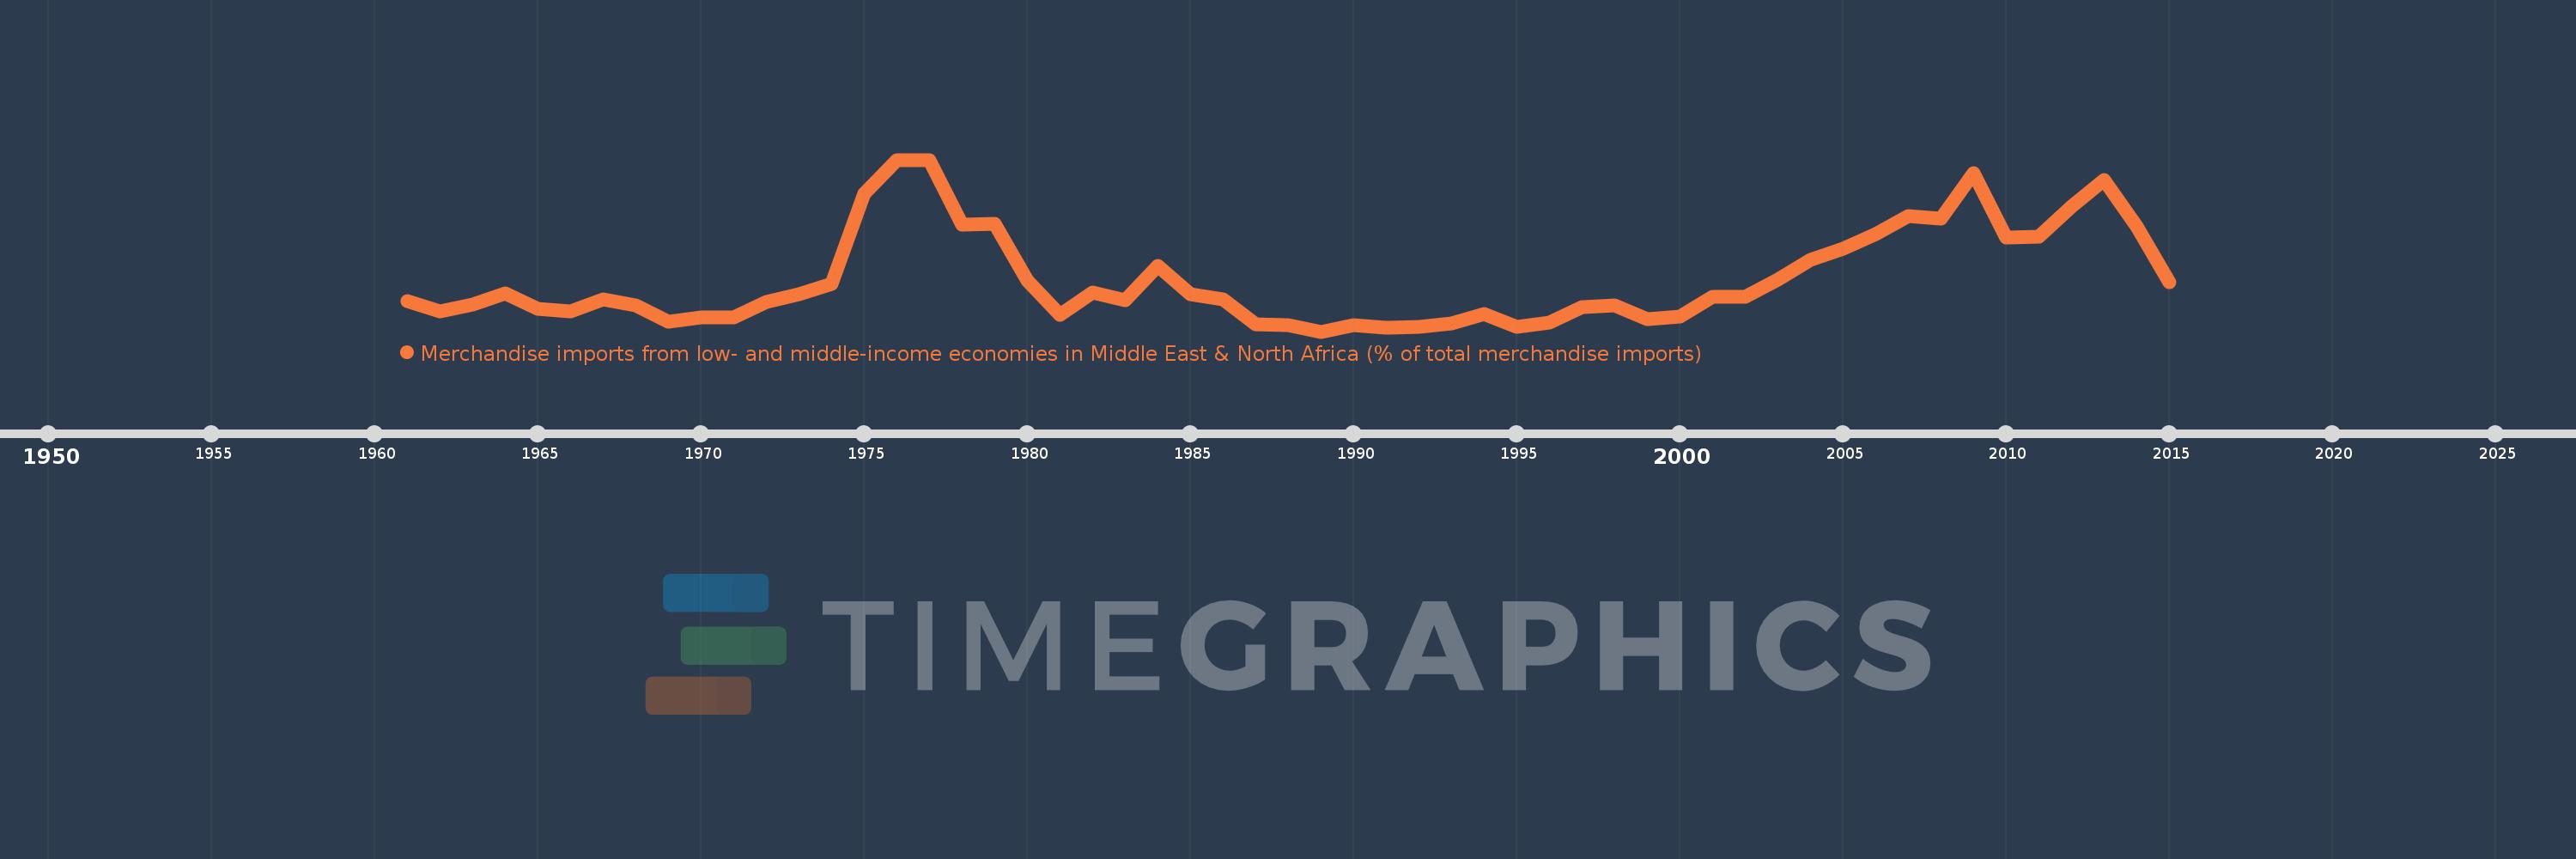
Merchandise imports from low- and middle-income economies in Middle East & North Africa (% of total merchandise imports)
2015,2014,2013,2012,2011,2010,2009,2008,2007,2006,2005,2004,2003,2002,2001,2000,1999,1998,1997,1996,1995,1994,1993,1992,1991,1990,1989,1988,1987,1986,1985,1984,1983,1982,1981,1980,1979,1978,1977,1976,1975,1974,1973,1972,1971,1970,1969,1968,1967,1966,1965,1964,1963,1962,1961
Estas estatísticas em outros países:
AfghanistanAlbaniaAlgeriaAngolaArab WorldArgentinaArmeniaArubaAustraliaAustriaAzerbaijanBahamas, TheBahrainBangladeshBarbadosBelarusBelgiumBelizeBeninBermudaBoliviaBosnia and HerzegovinaBrazilBrunei DarussalamBulgariaBurkina FasoBurundiCabo VerdeCambodiaCameroonCanadaCaribbean small statesCentral African RepublicCentral Europe and the BalticsChadChileChinaColombiaComorosCongo, Dem. Rep.Congo, Rep.Costa RicaCote d'IvoireCroatiaCubaCyprusCzech RepublicDenmarkDjiboutiDominicaDominican RepublicEarly-demographic dividendEast Asia & PacificEast Asia & Pacific (excluding high income)East Asia & Pacific (IDA & IBRD countries)EcuadorEgypt, Arab Rep.El SalvadorEstoniaEthiopiaEuro areaEurope & Central AsiaEurope & Central Asia (excluding high income)Europe & Central Asia (IDA & IBRD countries)European UnionFijiFinlandFragile and conflict affected situationsFranceFrench PolynesiaGabonGambia, TheGeorgiaGermanyGhanaGreeceGreenlandGrenadaGuatemalaGuineaGuinea-BissauGuyanaHaitiHeavily indebted poor countries (HIPC)High incomeHondurasHong Kong SAR, ChinaHungaryIBRD onlyIcelandIDA & IBRD totalIDA blendIDA onlyIDA totalIndiaIndonesiaIran, Islamic Rep.IraqIrelandIsraelItalyJamaicaJapanJordanKazakhstanKenyaKorea, Dem. People’s Rep.Korea, Rep.KosovoKuwaitKyrgyz RepublicLao PDRLate-demographic dividendLatin America & Caribbean Latin America & Caribbean (excluding high income)Latin America & the Caribbean (IDA & IBRD countries)LatviaLeast developed countries: UN classificationLebanonLiberiaLibyaLithuaniaLow & middle incomeLow incomeLower middle incomeLuxembourgMacao SAR, ChinaMacedonia, FYRMadagascarMalawiMalaysiaMaldivesMaliMaltaMauritaniaMauritiusMexicoMiddle East & North AfricaMiddle East & North Africa (excluding high income)Middle East & North Africa (IDA & IBRD countries)Middle incomeMoldovaMongoliaMontenegroMoroccoMozambiqueMyanmarNepalNetherlandsNew CaledoniaNew ZealandNicaraguaNigerNigeriaNorth AmericaNorwayOECD membersOmanOther small statesPacific island small statesPakistanPanamaPapua New GuineaParaguayPeruPhilippinesPolandPortugalPost-demographic dividendPre-demographic dividendQatarRomaniaRussian FederationRwandaSamoaSaudi ArabiaSenegalSerbiaSeychellesSierra LeoneSingaporeSlovak RepublicSloveniaSmall statesSomaliaSouth AfricaSouth AsiaSouth Asia (IDA & IBRD)SpainSri LankaSt. Kitts and NevisSt. LuciaSt. Vincent and the GrenadinesSub-Saharan Africa Sub-Saharan Africa (excluding high income)Sub-Saharan Africa (IDA & IBRD countries)SudanSurinameSwedenSwitzerlandSyrian Arab RepublicTajikistanTanzaniaThailandTogoTrinidad and TobagoTunisiaTurkeyTurkmenistanUgandaUkraineUnited Arab EmiratesUnited KingdomUnited StatesUpper middle incomeUruguayUzbekistanVenezuela, RBVietnamWorldYemen, Rep.ZambiaZimbabwe Linha do tempo:
Nesta escala de tempo está apresentado um gráfico de 1961 ano até 2015 ano Canada. Dados de 1960 ano ausente. O número de observações reais por data: 55.
Fonte (nome):
Indicadores de desenvolvimento mundial
Fonte (organização):
World Bank staff estimates based data from International Monetary Fund's Direction of Trade database.
Categorias:
Private Sector, Trade
Foi atualizado:
23 abr 2017 ano
Indicadores de alterações dos valores ao longo dos anos
Mínimo:
0.136
1 jan 1989 ano
Máximo:
2.622
1 jan 1977 ano
Na data de observação
Valor
Mudança absoluta
A alteração em relação ao valor anterior
1 jan 1961 ano
0.575
+0.575
0.0%
1 jan 1962 ano
0.423
-0.153
-26.52%
1 jan 1963 ano
0.532
+0.11
25.98%
1 jan 1964 ano
0.689
+0.156
29.38%
1 jan 1965 ano
0.462
-0.226
-32.87%
1 jan 1966 ano
0.428
-0.034
-7.45%
1 jan 1967 ano
0.596
+0.168
39.16%
1 jan 1968 ano
0.517
-0.079
-13.24%
1 jan 1969 ano
0.284
-0.233
-45.1%
1 jan 1970 ano
0.345
+0.061
21.55%
1 jan 1971 ano
0.338
-0.007
-2.0%
1 jan 1972 ano
0.57
+0.232
68.74%
1 jan 1973 ano
0.679
+0.109
19.09%
1 jan 1974 ano
0.829
+0.15
22.14%
1 jan 1975 ano
2.136
+1.307
157.54%
1 jan 1976 ano
2.61
+0.474
22.2%
1 jan 1977 ano
2.622
+0.012
0.45%
1 jan 1978 ano
1.68
-0.941
-35.91%
1 jan 1979 ano
1.694
+0.013
0.78%
1 jan 1980 ano
0.873
-0.821
-48.47%
1 jan 1981 ano
0.378
-0.494
-56.66%
1 jan 1982 ano
0.707
+0.329
87.05%
1 jan 1983 ano
0.594
-0.114
-16.06%
1 jan 1984 ano
1.084
+0.49
82.59%
1 jan 1985 ano
0.678
-0.406
-37.45%
1 jan 1986 ano
0.602
-0.076
-11.21%
1 jan 1987 ano
0.242
-0.36
-59.78%
1 jan 1988 ano
0.235
-0.008
-3.12%
1 jan 1989 ano
0.136
-0.098
-41.91%
1 jan 1990 ano
0.224
+0.088
64.57%
1 jan 1991 ano
0.191
-0.034
-15.07%
1 jan 1992 ano
0.2
+0.01
5.12%
1 jan 1993 ano
0.256
+0.056
27.76%
1 jan 1994 ano
0.397
+0.141
55.1%
1 jan 1995 ano
0.201
-0.196
-49.38%
1 jan 1996 ano
0.267
+0.066
32.9%
1 jan 1997 ano
0.488
+0.221
82.59%
1 jan 1998 ano
0.515
+0.027
5.55%
1 jan 1999 ano
0.317
-0.198
-38.43%
1 jan 2000 ano
0.348
+0.031
9.87%
1 jan 2001 ano
0.634
+0.286
82.09%
1 jan 2002 ano
0.636
+0.002
0.27%
1 jan 2003 ano
0.888
+0.252
39.65%
1 jan 2004 ano
1.174
+0.286
32.23%
1 jan 2005 ano
1.336
+0.162
13.77%
1 jan 2006 ano
1.548
+0.212
15.89%
1 jan 2007 ano
1.804
+0.256
16.56%
1 jan 2008 ano
1.767
-0.037
-2.08%
1 jan 2009 ano
2.431
+0.664
37.6%
1 jan 2010 ano
1.493
-0.938
-38.58%
1 jan 2011 ano
1.512
+0.019
1.28%
1 jan 2012 ano
1.94
+0.428
28.3%
1 jan 2013 ano
2.325
+0.385
19.85%
1 jan 2014 ano
1.66
-0.665
-28.62%
1 jan 2015 ano
0.849
-0.811
-48.88%
Classificação de países por estatísticas atuais por anos


Comentários: