29
/pt/
pt
AIzaSyAYiBZKx7MnpbEhh9jyipgxe19OcubqV5w
April 1, 2024
152799
Hungary
HUN
true
2
1
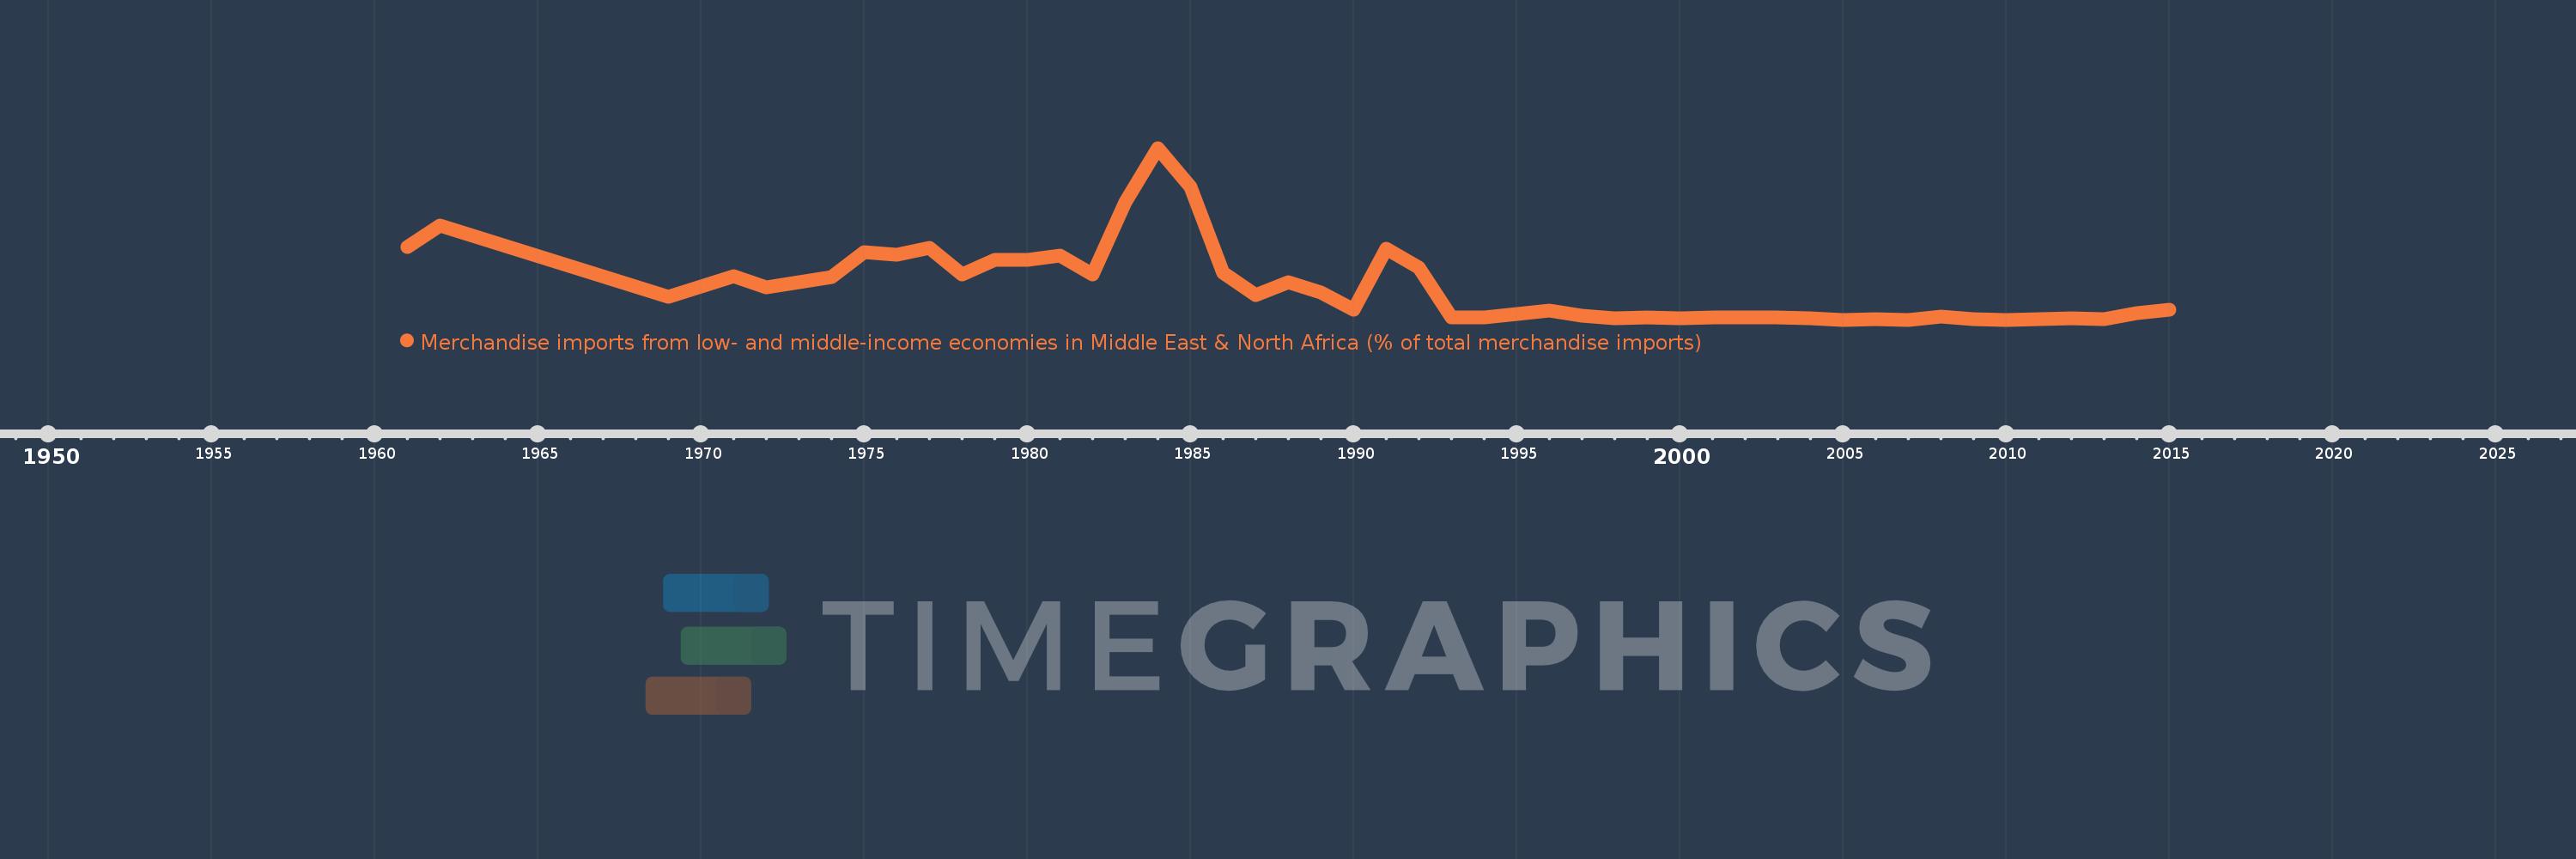
Merchandise imports from low- and middle-income economies in Middle East & North Africa (% of total merchandise imports)
2015,2014,2013,2012,2011,2010,2009,2008,2007,2006,2005,2004,2003,2002,2001,2000,1999,1998,1997,1996,1995,1994,1993,1992,1991,1990,1989,1988,1987,1986,1985,1984,1983,1982,1981,1980,1979,1978,1977,1976,1975,1974,1973,1972,1971,1970,1969,1962,1961
Estas estatísticas em outros países:
AfghanistanAlbaniaAlgeriaAngolaArab WorldArgentinaArmeniaArubaAustraliaAustriaAzerbaijanBahamas, TheBahrainBangladeshBarbadosBelarusBelgiumBelizeBeninBermudaBoliviaBosnia and HerzegovinaBrazilBrunei DarussalamBulgariaBurkina FasoBurundiCabo VerdeCambodiaCameroonCanadaCaribbean small statesCentral African RepublicCentral Europe and the BalticsChadChileChinaColombiaComorosCongo, Dem. Rep.Congo, Rep.Costa RicaCote d'IvoireCroatiaCubaCyprusCzech RepublicDenmarkDjiboutiDominicaDominican RepublicEarly-demographic dividendEast Asia & PacificEast Asia & Pacific (excluding high income)East Asia & Pacific (IDA & IBRD countries)EcuadorEgypt, Arab Rep.El SalvadorEstoniaEthiopiaEuro areaEurope & Central AsiaEurope & Central Asia (excluding high income)Europe & Central Asia (IDA & IBRD countries)European UnionFijiFinlandFragile and conflict affected situationsFranceFrench PolynesiaGabonGambia, TheGeorgiaGermanyGhanaGreeceGreenlandGrenadaGuatemalaGuineaGuinea-BissauGuyanaHaitiHeavily indebted poor countries (HIPC)High incomeHondurasHong Kong SAR, ChinaHungaryIBRD onlyIcelandIDA & IBRD totalIDA blendIDA onlyIDA totalIndiaIndonesiaIran, Islamic Rep.IraqIrelandIsraelItalyJamaicaJapanJordanKazakhstanKenyaKorea, Dem. People’s Rep.Korea, Rep.KosovoKuwaitKyrgyz RepublicLao PDRLate-demographic dividendLatin America & Caribbean Latin America & Caribbean (excluding high income)Latin America & the Caribbean (IDA & IBRD countries)LatviaLeast developed countries: UN classificationLebanonLiberiaLibyaLithuaniaLow & middle incomeLow incomeLower middle incomeLuxembourgMacao SAR, ChinaMacedonia, FYRMadagascarMalawiMalaysiaMaldivesMaliMaltaMauritaniaMauritiusMexicoMiddle East & North AfricaMiddle East & North Africa (excluding high income)Middle East & North Africa (IDA & IBRD countries)Middle incomeMoldovaMongoliaMontenegroMoroccoMozambiqueMyanmarNepalNetherlandsNew CaledoniaNew ZealandNicaraguaNigerNigeriaNorth AmericaNorwayOECD membersOmanOther small statesPacific island small statesPakistanPanamaPapua New GuineaParaguayPeruPhilippinesPolandPortugalPost-demographic dividendPre-demographic dividendQatarRomaniaRussian FederationRwandaSamoaSaudi ArabiaSenegalSerbiaSeychellesSierra LeoneSingaporeSlovak RepublicSloveniaSmall statesSomaliaSouth AfricaSouth AsiaSouth Asia (IDA & IBRD)SpainSri LankaSt. Kitts and NevisSt. LuciaSt. Vincent and the GrenadinesSub-Saharan Africa Sub-Saharan Africa (excluding high income)Sub-Saharan Africa (IDA & IBRD countries)SudanSurinameSwedenSwitzerlandSyrian Arab RepublicTajikistanTanzaniaThailandTogoTrinidad and TobagoTunisiaTurkeyTurkmenistanUgandaUkraineUnited Arab EmiratesUnited KingdomUnited StatesUpper middle incomeUruguayUzbekistanVenezuela, RBVietnamWorldYemen, Rep.ZambiaZimbabwe Linha do tempo:
Nesta escala de tempo está apresentado um gráfico de 1961 ano até 2015 ano Hungary. Dados de 1960 ano ausente. O número de observações reais por data: 49.
Fonte (nome):
Indicadores de desenvolvimento mundial
Fonte (organização):
World Bank staff estimates based data from International Monetary Fund's Direction of Trade database.
Categorias:
Private Sector, Trade
Foi atualizado:
23 abr 2017 ano
Indicadores de alterações dos valores ao longo dos anos
Mínimo:
0.034
1 jan 2007 ano
Máximo:
7.694
1 jan 1984 ano
Na data de observação
Valor
Mudança absoluta
A alteração em relação ao valor anterior
1 jan 1961 ano
3.296
+3.296
0.0%
1 jan 1962 ano
4.235
+0.939
28.5%
1 jan 1969 ano
1.05
-3.185
-75.2%
1 jan 1970 ano
1.5
+0.449
42.8%
1 jan 1971 ano
1.958
+0.458
30.56%
1 jan 1972 ano
1.484
-0.474
-24.19%
1 jan 1973 ano
1.699
+0.215
14.49%
1 jan 1974 ano
1.928
+0.229
13.48%
1 jan 1975 ano
3.051
+1.123
58.22%
1 jan 1976 ano
2.922
-0.129
-4.23%
1 jan 1977 ano
3.243
+0.32
10.97%
1 jan 1978 ano
2.051
-1.191
-36.74%
1 jan 1979 ano
2.687
+0.636
31.01%
1 jan 1980 ano
2.722
+0.034
1.27%
1 jan 1981 ano
2.882
+0.16
5.89%
1 jan 1982 ano
2.047
-0.835
-28.98%
1 jan 1983 ano
5.268
+3.221
157.39%
1 jan 1984 ano
7.694
+2.426
46.04%
1 jan 1985 ano
5.963
-1.73
-22.49%
1 jan 1986 ano
2.147
-3.816
-63.99%
1 jan 1987 ano
1.148
-0.999
-46.55%
1 jan 1988 ano
1.726
+0.578
50.37%
1 jan 1989 ano
1.238
-0.487
-28.25%
1 jan 1990 ano
0.463
-0.775
-62.6%
1 jan 1991 ano
3.183
+2.72
587.18%
1 jan 1992 ano
2.352
-0.83
-26.09%
1 jan 1993 ano
0.135
-2.217
-94.26%
1 jan 1994 ano
0.124
-0.011
-7.91%
1 jan 1995 ano
0.298
+0.174
139.92%
1 jan 1996 ano
0.462
+0.164
54.82%
1 jan 1997 ano
0.231
-0.231
-49.95%
1 jan 1998 ano
0.115
-0.116
-50.3%
1 jan 1999 ano
0.119
+0.005
3.96%
1 jan 2000 ano
0.114
-0.005
-4.13%
1 jan 2001 ano
0.143
+0.029
25.11%
1 jan 2002 ano
0.132
-0.011
-7.92%
1 jan 2003 ano
0.135
+0.004
2.66%
1 jan 2004 ano
0.111
-0.024
-18.07%
1 jan 2005 ano
0.037
-0.074
-66.54%
1 jan 2006 ano
0.046
+0.009
24.18%
1 jan 2007 ano
0.034
-0.013
-27.3%
1 jan 2008 ano
0.162
+0.128
382.84%
1 jan 2009 ano
0.056
-0.106
-65.28%
1 jan 2010 ano
0.039
-0.018
-31.38%
1 jan 2011 ano
0.048
+0.009
23.71%
1 jan 2012 ano
0.116
+0.068
142.54%
1 jan 2013 ano
0.077
-0.038
-33.02%
1 jan 2014 ano
0.312
+0.234
302.5%
1 jan 2015 ano
0.464
+0.152
48.66%
Classificação de países por estatísticas atuais por anos


Comentários: