29
/pt/
pt
AIzaSyAYiBZKx7MnpbEhh9jyipgxe19OcubqV5w
April 1, 2024
160283
Israel
ISR
true
2
1
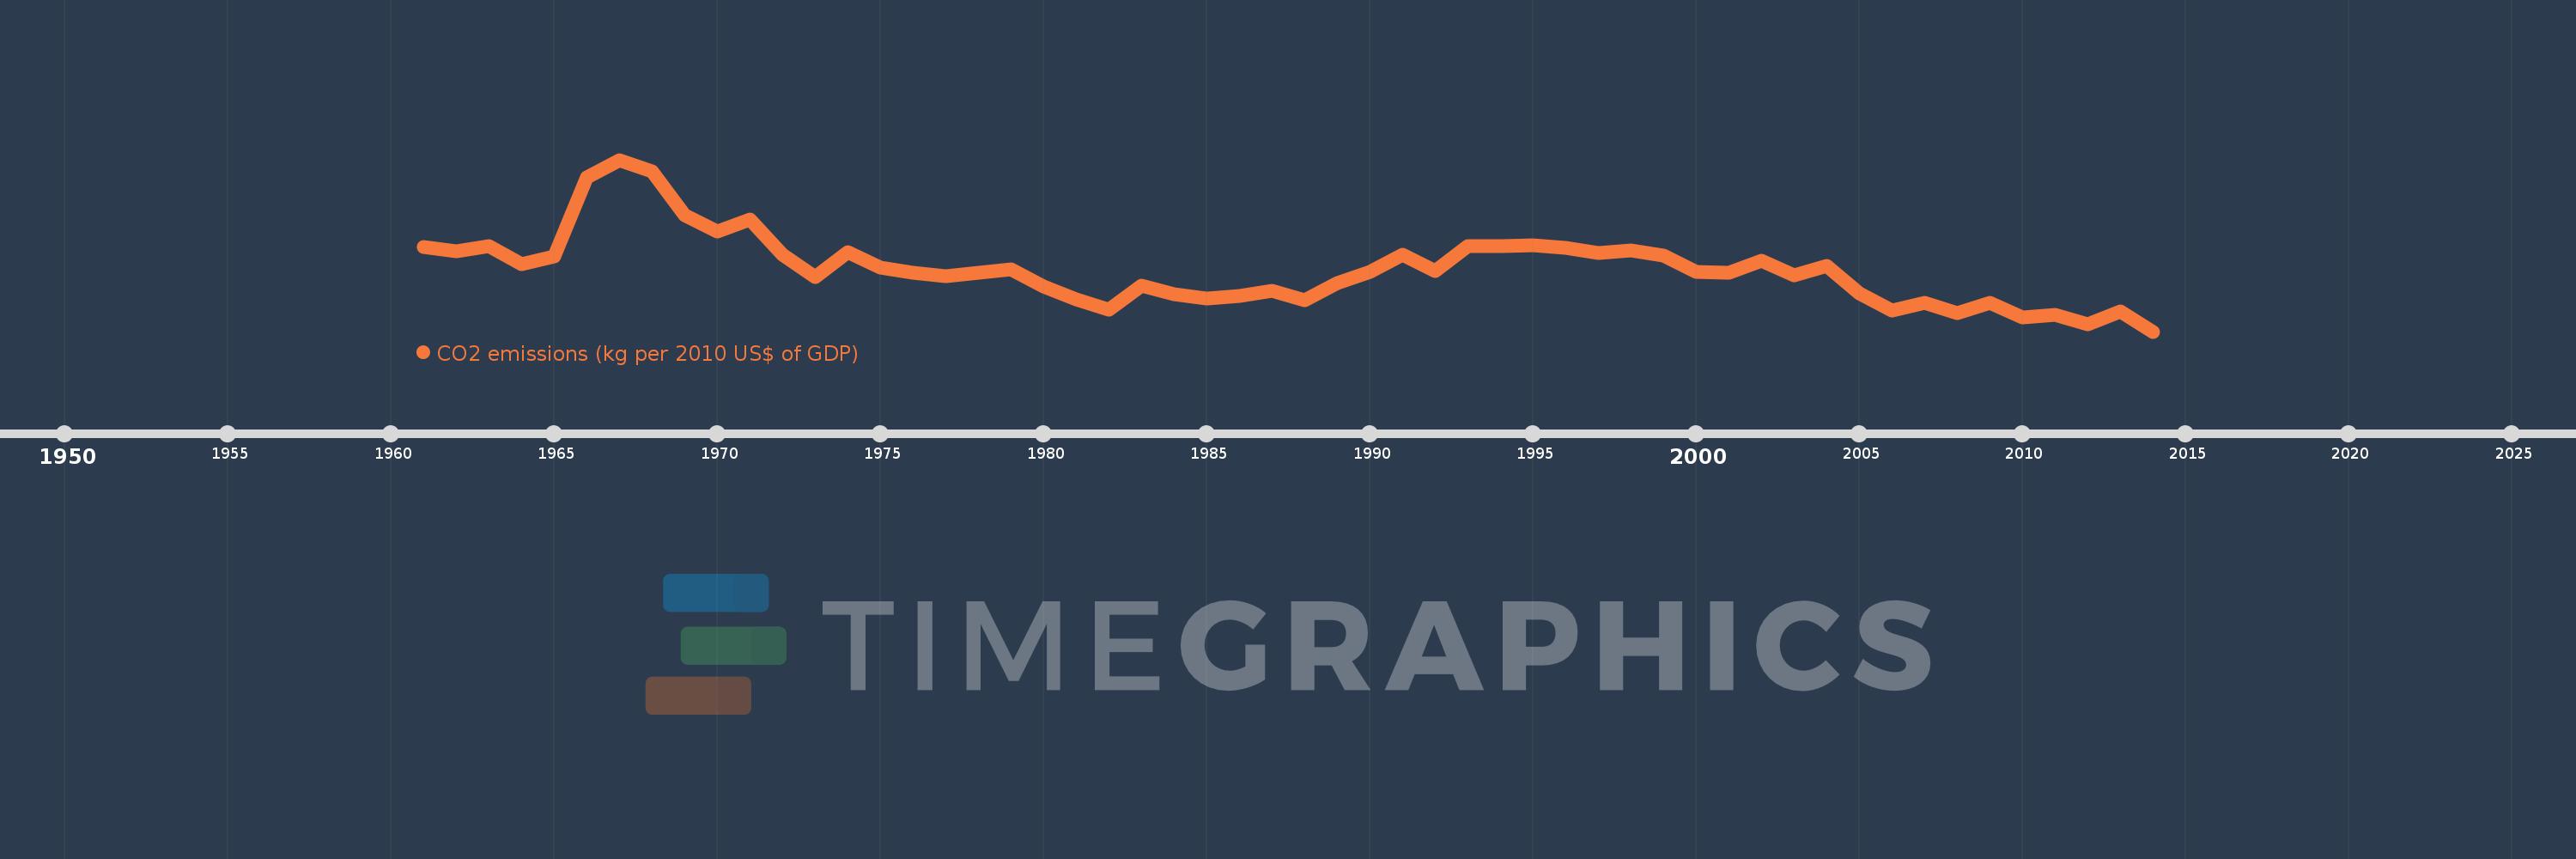
CO2 emissions (kg per 2010 US$ of GDP)
2014,2013,2012,2011,2010,2009,2008,2007,2006,2005,2004,2003,2002,2001,2000,1999,1998,1997,1996,1995,1994,1993,1992,1991,1990,1989,1988,1987,1986,1985,1984,1983,1982,1981,1980,1979,1978,1977,1976,1975,1974,1973,1972,1971,1970,1969,1968,1967,1966,1965,1964,1963,1962,1961
Estas estatísticas em outros países:
AfghanistanAlbaniaAlgeriaAndorraAngolaAntigua and BarbudaArab WorldArgentinaArmeniaArubaAustraliaAustriaAzerbaijanBahamas, TheBahrainBangladeshBarbadosBelarusBelgiumBelizeBeninBermudaBhutanBoliviaBosnia and HerzegovinaBotswanaBrazilBrunei DarussalamBulgariaBurkina FasoBurundiCabo VerdeCambodiaCameroonCanadaCaribbean small statesCentral African RepublicCentral Europe and the BalticsChadChileChinaColombiaComorosCongo, Dem. Rep.Congo, Rep.Costa RicaCote d'IvoireCroatiaCubaCyprusCzech RepublicDenmarkDjiboutiDominicaDominican RepublicEarly-demographic dividendEast Asia & PacificEast Asia & Pacific (excluding high income)East Asia & Pacific (IDA & IBRD countries)EcuadorEgypt, Arab Rep.El SalvadorEquatorial GuineaEritreaEstoniaEthiopiaEuro areaEurope & Central AsiaEurope & Central Asia (excluding high income)Europe & Central Asia (IDA & IBRD countries)European UnionFaroe IslandsFijiFinlandFragile and conflict affected situationsFranceGabonGambia, TheGeorgiaGermanyGhanaGreeceGreenlandGrenadaGuatemalaGuineaGuinea-BissauGuyanaHaitiHeavily indebted poor countries (HIPC)High incomeHondurasHong Kong SAR, ChinaHungaryIBRD onlyIcelandIDA & IBRD totalIDA blendIDA onlyIDA totalIndiaIndonesiaIran, Islamic Rep.IraqIrelandIsraelItalyJamaicaJapanJordanKazakhstanKenyaKiribatiKorea, Rep.KuwaitKyrgyz RepublicLao PDRLate-demographic dividendLatin America & Caribbean Latin America & Caribbean (excluding high income)Latin America & the Caribbean (IDA & IBRD countries)LatviaLeast developed countries: UN classificationLebanonLesothoLiberiaLibyaLiechtensteinLithuaniaLow & middle incomeLow incomeLower middle incomeLuxembourgMacao SAR, ChinaMacedonia, FYRMadagascarMalawiMalaysiaMaldivesMaliMaltaMarshall IslandsMauritaniaMauritiusMexicoMicronesia, Fed. Sts.Middle East & North AfricaMiddle East & North Africa (excluding high income)Middle East & North Africa (IDA & IBRD countries)Middle incomeMoldovaMongoliaMontenegroMoroccoMozambiqueMyanmarNamibiaNauruNepalNetherlandsNew ZealandNicaraguaNigerNigeriaNorth AmericaNorwayOECD membersOmanOther small statesPacific island small statesPakistanPalauPanamaPapua New GuineaParaguayPeruPhilippinesPolandPortugalPost-demographic dividendPre-demographic dividendQatarRomaniaRussian FederationRwandaSamoaSao Tome and PrincipeSaudi ArabiaSenegalSerbiaSeychellesSierra LeoneSingaporeSlovak RepublicSloveniaSmall statesSolomon IslandsSouth AfricaSouth AsiaSouth Asia (IDA & IBRD)South SudanSpainSri LankaSt. Kitts and NevisSt. LuciaSt. Vincent and the GrenadinesSub-Saharan Africa Sub-Saharan Africa (excluding high income)Sub-Saharan Africa (IDA & IBRD countries)SudanSurinameSwazilandSwedenSwitzerlandTajikistanTanzaniaThailandTimor-LesteTogoTongaTrinidad and TobagoTunisiaTurkeyTurkmenistanUgandaUkraineUnited Arab EmiratesUnited KingdomUnited StatesUpper middle incomeUruguayUzbekistanVanuatuVenezuela, RBVietnamWest Bank and GazaWorldYemen, Rep.ZambiaZimbabwe Linha do tempo:
Nesta escala de tempo está apresentado um gráfico de 1961 ano até 2014 ano Israel. Dados de 1960 ano ausente. O número de observações reais por data: 54.
Fonte (nome):
Indicadores de desenvolvimento mundial
Fonte (organização):
Carbon Dioxide Information Analysis Center, Environmental Sciences Division, Oak Ridge National Laboratory, Tennessee, United States.
Categorias:
Climate Change, Environment
Foi atualizado:
23 abr 2017 ano
Indicadores de alterações dos valores ao longo dos anos
Mínimo:
0.271
1 jan 2014 ano
Máximo:
0.517
1 jan 1967 ano
Na data de observação
Valor
Mudança absoluta
A alteração em relação ao valor anterior
1 jan 1961 ano
0.392
+0.392
0.0%
1 jan 1962 ano
0.386
-0.007
-1.71%
1 jan 1963 ano
0.393
+0.008
1.99%
1 jan 1964 ano
0.367
-0.026
-6.62%
1 jan 1965 ano
0.379
+0.012
3.24%
1 jan 1966 ano
0.492
+0.113
29.69%
1 jan 1967 ano
0.517
+0.025
5.13%
1 jan 1968 ano
0.5
-0.017
-3.3%
1 jan 1969 ano
0.438
-0.061
-12.27%
1 jan 1970 ano
0.414
-0.024
-5.52%
1 jan 1971 ano
0.432
+0.018
4.26%
1 jan 1972 ano
0.381
-0.051
-11.88%
1 jan 1973 ano
0.349
-0.032
-8.31%
1 jan 1974 ano
0.385
+0.036
10.34%
1 jan 1975 ano
0.363
-0.022
-5.74%
1 jan 1976 ano
0.355
-0.008
-2.21%
1 jan 1977 ano
0.35
-0.005
-1.48%
1 jan 1978 ano
0.355
+0.005
1.45%
1 jan 1979 ano
0.36
+0.006
1.56%
1 jan 1980 ano
0.336
-0.024
-6.61%
1 jan 1981 ano
0.317
-0.02
-5.86%
1 jan 1982 ano
0.302
-0.015
-4.6%
1 jan 1983 ano
0.337
+0.035
11.5%
1 jan 1984 ano
0.324
-0.013
-3.97%
1 jan 1985 ano
0.318
-0.006
-1.7%
1 jan 1986 ano
0.322
+0.004
1.25%
1 jan 1987 ano
0.329
+0.007
2.17%
1 jan 1988 ano
0.316
-0.013
-4.05%
1 jan 1989 ano
0.34
+0.024
7.56%
1 jan 1990 ano
0.356
+0.016
4.76%
1 jan 1991 ano
0.381
+0.025
6.98%
1 jan 1992 ano
0.358
-0.023
-5.98%
1 jan 1993 ano
0.394
+0.037
10.22%
1 jan 1994 ano
0.394
-0.001
-0.21%
1 jan 1995 ano
0.395
+0.002
0.42%
1 jan 1996 ano
0.391
-0.004
-0.96%
1 jan 1997 ano
0.383
-0.008
-2.12%
1 jan 1998 ano
0.387
+0.004
1.11%
1 jan 1999 ano
0.38
-0.008
-1.99%
1 jan 2000 ano
0.357
-0.023
-5.97%
1 jan 2001 ano
0.355
-0.002
-0.68%
1 jan 2002 ano
0.373
+0.019
5.28%
1 jan 2003 ano
0.351
-0.022
-5.89%
1 jan 2004 ano
0.365
+0.014
3.92%
1 jan 2005 ano
0.326
-0.039
-10.72%
1 jan 2006 ano
0.301
-0.025
-7.56%
1 jan 2007 ano
0.312
+0.011
3.68%
1 jan 2008 ano
0.297
-0.015
-4.87%
1 jan 2009 ano
0.312
+0.015
5.02%
1 jan 2010 ano
0.291
-0.021
-6.74%
1 jan 2011 ano
0.295
+0.004
1.26%
1 jan 2012 ano
0.281
-0.013
-4.47%
1 jan 2013 ano
0.3
+0.019
6.71%
1 jan 2014 ano
0.271
-0.03
-9.84%
Classificação de países por estatísticas atuais por anos


Comentários: