29
/pt/
pt
AIzaSyAYiBZKx7MnpbEhh9jyipgxe19OcubqV5w
April 1, 2024
104652
Chile
CHL
true
2
1
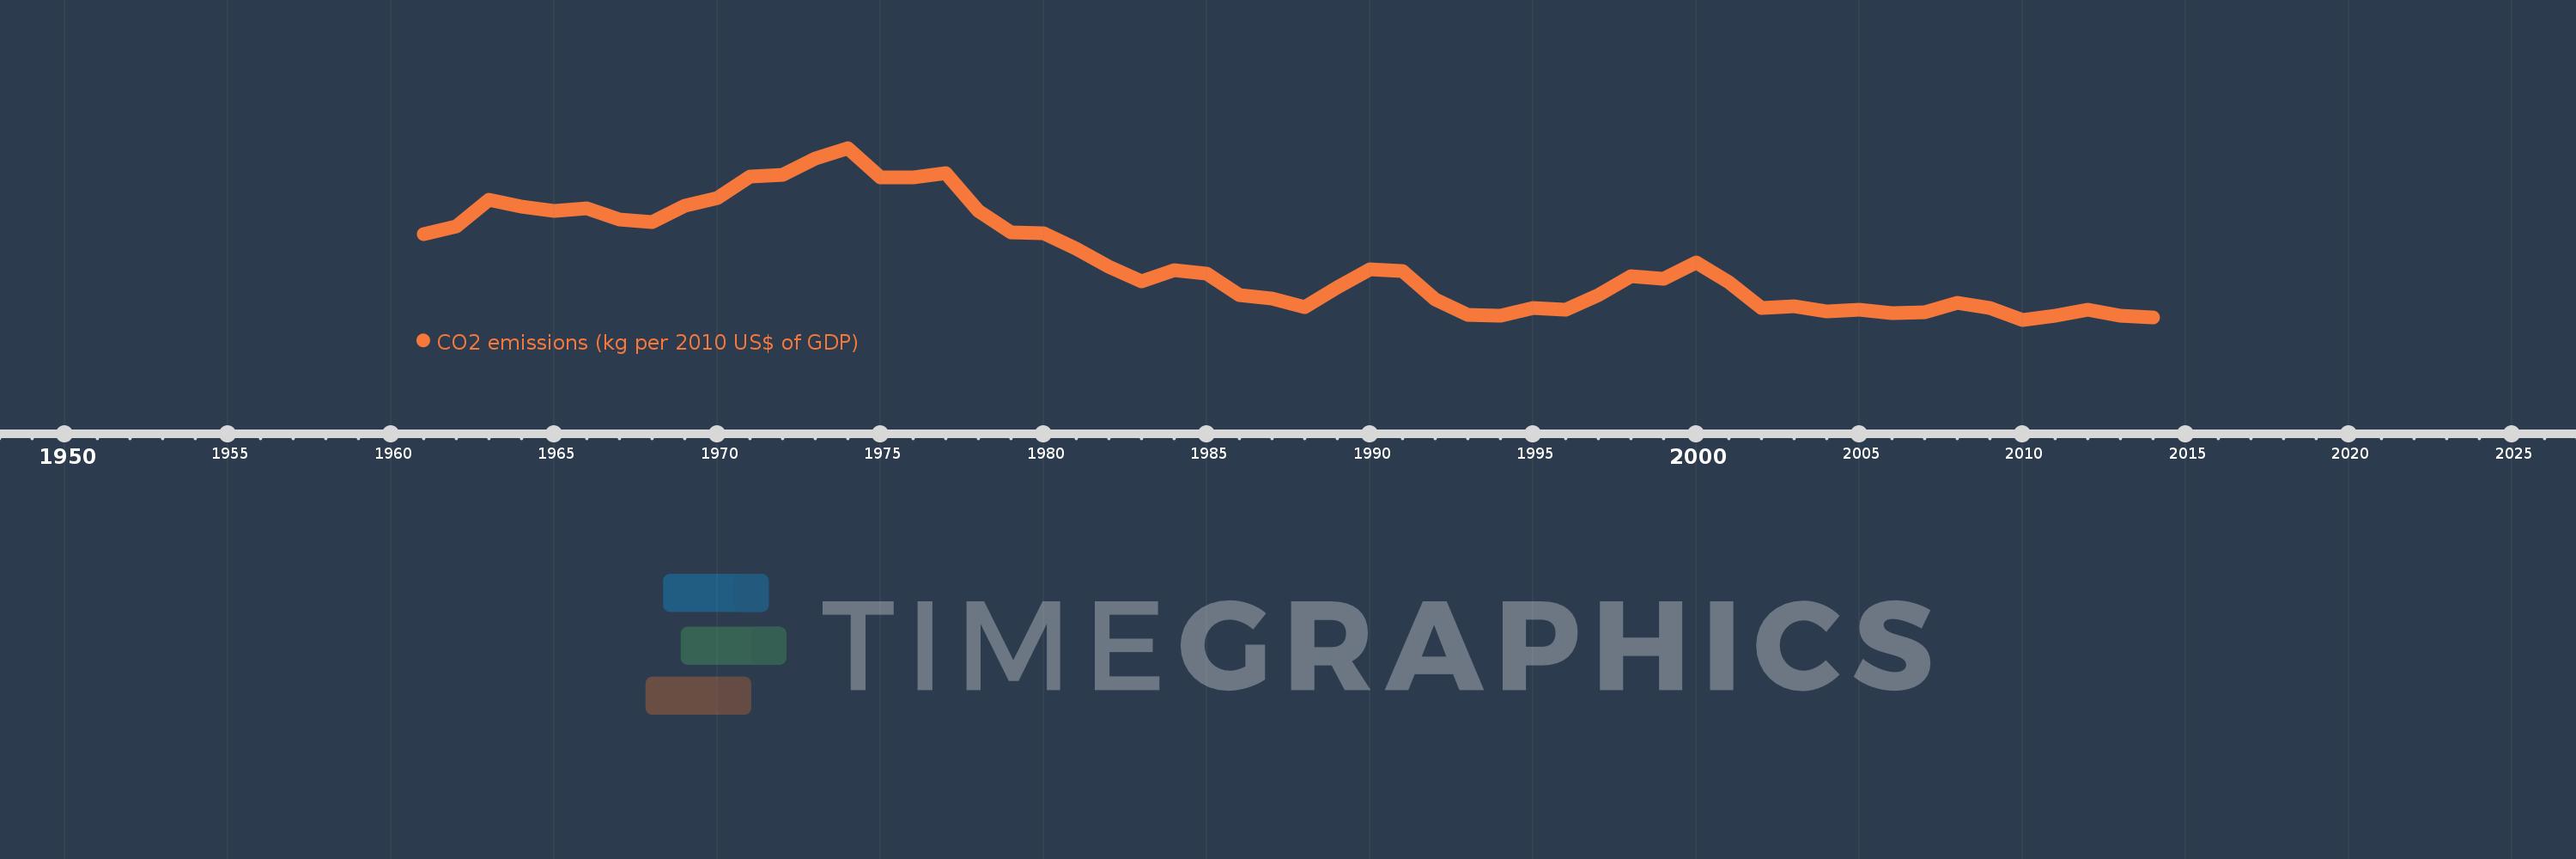
CO2 emissions (kg per 2010 US$ of GDP)
2014,2013,2012,2011,2010,2009,2008,2007,2006,2005,2004,2003,2002,2001,2000,1999,1998,1997,1996,1995,1994,1993,1992,1991,1990,1989,1988,1987,1986,1985,1984,1983,1982,1981,1980,1979,1978,1977,1976,1975,1974,1973,1972,1971,1970,1969,1968,1967,1966,1965,1964,1963,1962,1961
Estas estatísticas em outros países:
AfghanistanAlbaniaAlgeriaAndorraAngolaAntigua and BarbudaArab WorldArgentinaArmeniaArubaAustraliaAustriaAzerbaijanBahamas, TheBahrainBangladeshBarbadosBelarusBelgiumBelizeBeninBermudaBhutanBoliviaBosnia and HerzegovinaBotswanaBrazilBrunei DarussalamBulgariaBurkina FasoBurundiCabo VerdeCambodiaCameroonCanadaCaribbean small statesCentral African RepublicCentral Europe and the BalticsChadChileChinaColombiaComorosCongo, Dem. Rep.Congo, Rep.Costa RicaCote d'IvoireCroatiaCubaCyprusCzech RepublicDenmarkDjiboutiDominicaDominican RepublicEarly-demographic dividendEast Asia & PacificEast Asia & Pacific (excluding high income)East Asia & Pacific (IDA & IBRD countries)EcuadorEgypt, Arab Rep.El SalvadorEquatorial GuineaEritreaEstoniaEthiopiaEuro areaEurope & Central AsiaEurope & Central Asia (excluding high income)Europe & Central Asia (IDA & IBRD countries)European UnionFaroe IslandsFijiFinlandFragile and conflict affected situationsFranceGabonGambia, TheGeorgiaGermanyGhanaGreeceGreenlandGrenadaGuatemalaGuineaGuinea-BissauGuyanaHaitiHeavily indebted poor countries (HIPC)High incomeHondurasHong Kong SAR, ChinaHungaryIBRD onlyIcelandIDA & IBRD totalIDA blendIDA onlyIDA totalIndiaIndonesiaIran, Islamic Rep.IraqIrelandIsraelItalyJamaicaJapanJordanKazakhstanKenyaKiribatiKorea, Rep.KuwaitKyrgyz RepublicLao PDRLate-demographic dividendLatin America & Caribbean Latin America & Caribbean (excluding high income)Latin America & the Caribbean (IDA & IBRD countries)LatviaLeast developed countries: UN classificationLebanonLesothoLiberiaLibyaLiechtensteinLithuaniaLow & middle incomeLow incomeLower middle incomeLuxembourgMacao SAR, ChinaMacedonia, FYRMadagascarMalawiMalaysiaMaldivesMaliMaltaMarshall IslandsMauritaniaMauritiusMexicoMicronesia, Fed. Sts.Middle East & North AfricaMiddle East & North Africa (excluding high income)Middle East & North Africa (IDA & IBRD countries)Middle incomeMoldovaMongoliaMontenegroMoroccoMozambiqueMyanmarNamibiaNauruNepalNetherlandsNew ZealandNicaraguaNigerNigeriaNorth AmericaNorwayOECD membersOmanOther small statesPacific island small statesPakistanPalauPanamaPapua New GuineaParaguayPeruPhilippinesPolandPortugalPost-demographic dividendPre-demographic dividendQatarRomaniaRussian FederationRwandaSamoaSao Tome and PrincipeSaudi ArabiaSenegalSerbiaSeychellesSierra LeoneSingaporeSlovak RepublicSloveniaSmall statesSolomon IslandsSouth AfricaSouth AsiaSouth Asia (IDA & IBRD)South SudanSpainSri LankaSt. Kitts and NevisSt. LuciaSt. Vincent and the GrenadinesSub-Saharan Africa Sub-Saharan Africa (excluding high income)Sub-Saharan Africa (IDA & IBRD countries)SudanSurinameSwazilandSwedenSwitzerlandTajikistanTanzaniaThailandTimor-LesteTogoTongaTrinidad and TobagoTunisiaTurkeyTurkmenistanUgandaUkraineUnited Arab EmiratesUnited KingdomUnited StatesUpper middle incomeUruguayUzbekistanVanuatuVenezuela, RBVietnamWest Bank and GazaWorldYemen, Rep.ZambiaZimbabwe Linha do tempo:
Nesta escala de tempo está apresentado um gráfico de 1961 ano até 2014 ano Chile. Dados de 1960 ano ausente. O número de observações reais por data: 54.
Fonte (nome):
Indicadores de desenvolvimento mundial
Fonte (organização):
Carbon Dioxide Information Analysis Center, Environmental Sciences Division, Oak Ridge National Laboratory, Tennessee, United States.
Categorias:
Climate Change, Environment
Foi atualizado:
23 abr 2017 ano
Indicadores de alterações dos valores ao longo dos anos
Mínimo:
0.325
1 jan 2010 ano
Máximo:
0.643
1 jan 1974 ano
Na data de observação
Valor
Mudança absoluta
A alteração em relação ao valor anterior
1 jan 1961 ano
0.483
+0.483
0.0%
1 jan 1962 ano
0.498
+0.015
3.11%
1 jan 1963 ano
0.547
+0.049
9.85%
1 jan 1964 ano
0.535
-0.012
-2.21%
1 jan 1965 ano
0.526
-0.009
-1.65%
1 jan 1966 ano
0.531
+0.005
0.96%
1 jan 1967 ano
0.511
-0.02
-3.84%
1 jan 1968 ano
0.505
-0.006
-1.12%
1 jan 1969 ano
0.536
+0.031
6.22%
1 jan 1970 ano
0.551
+0.015
2.71%
1 jan 1971 ano
0.59
+0.039
7.08%
1 jan 1972 ano
0.594
+0.005
0.77%
1 jan 1973 ano
0.624
+0.029
4.91%
1 jan 1974 ano
0.643
+0.02
3.19%
1 jan 1975 ano
0.589
-0.054
-8.42%
1 jan 1976 ano
0.589
+0.0
0.04%
1 jan 1977 ano
0.597
+0.008
1.28%
1 jan 1978 ano
0.527
-0.07
-11.79%
1 jan 1979 ano
0.487
-0.04
-7.59%
1 jan 1980 ano
0.485
-0.002
-0.31%
1 jan 1981 ano
0.456
-0.029
-6.03%
1 jan 1982 ano
0.423
-0.033
-7.21%
1 jan 1983 ano
0.396
-0.027
-6.37%
1 jan 1984 ano
0.416
+0.02
5.06%
1 jan 1985 ano
0.41
-0.006
-1.34%
1 jan 1986 ano
0.371
-0.039
-9.58%
1 jan 1987 ano
0.364
-0.008
-2.02%
1 jan 1988 ano
0.348
-0.016
-4.39%
1 jan 1989 ano
0.385
+0.037
10.67%
1 jan 1990 ano
0.419
+0.034
8.79%
1 jan 1991 ano
0.415
-0.003
-0.8%
1 jan 1992 ano
0.362
-0.054
-12.92%
1 jan 1993 ano
0.334
-0.028
-7.66%
1 jan 1994 ano
0.333
-0.001
-0.33%
1 jan 1995 ano
0.346
+0.014
4.1%
1 jan 1996 ano
0.343
-0.003
-0.97%
1 jan 1997 ano
0.371
+0.028
8.16%
1 jan 1998 ano
0.405
+0.034
9.07%
1 jan 1999 ano
0.401
-0.004
-0.99%
1 jan 2000 ano
0.431
+0.03
7.52%
1 jan 2001 ano
0.394
-0.037
-8.48%
1 jan 2002 ano
0.346
-0.048
-12.25%
1 jan 2003 ano
0.35
+0.004
1.22%
1 jan 2004 ano
0.34
-0.011
-3.04%
1 jan 2005 ano
0.344
+0.005
1.38%
1 jan 2006 ano
0.337
-0.007
-2.03%
1 jan 2007 ano
0.339
+0.001
0.42%
1 jan 2008 ano
0.356
+0.017
5.1%
1 jan 2009 ano
0.346
-0.01
-2.9%
1 jan 2010 ano
0.325
-0.021
-6.05%
1 jan 2011 ano
0.332
+0.007
2.27%
1 jan 2012 ano
0.344
+0.012
3.63%
1 jan 2013 ano
0.333
-0.011
-3.1%
1 jan 2014 ano
0.329
-0.004
-1.22%
Classificação de países por estatísticas atuais por anos


Comentários: