29
/pt/
pt
AIzaSyAYiBZKx7MnpbEhh9jyipgxe19OcubqV5w
April 1, 2024
106980
Colombia
COL
true
2
1
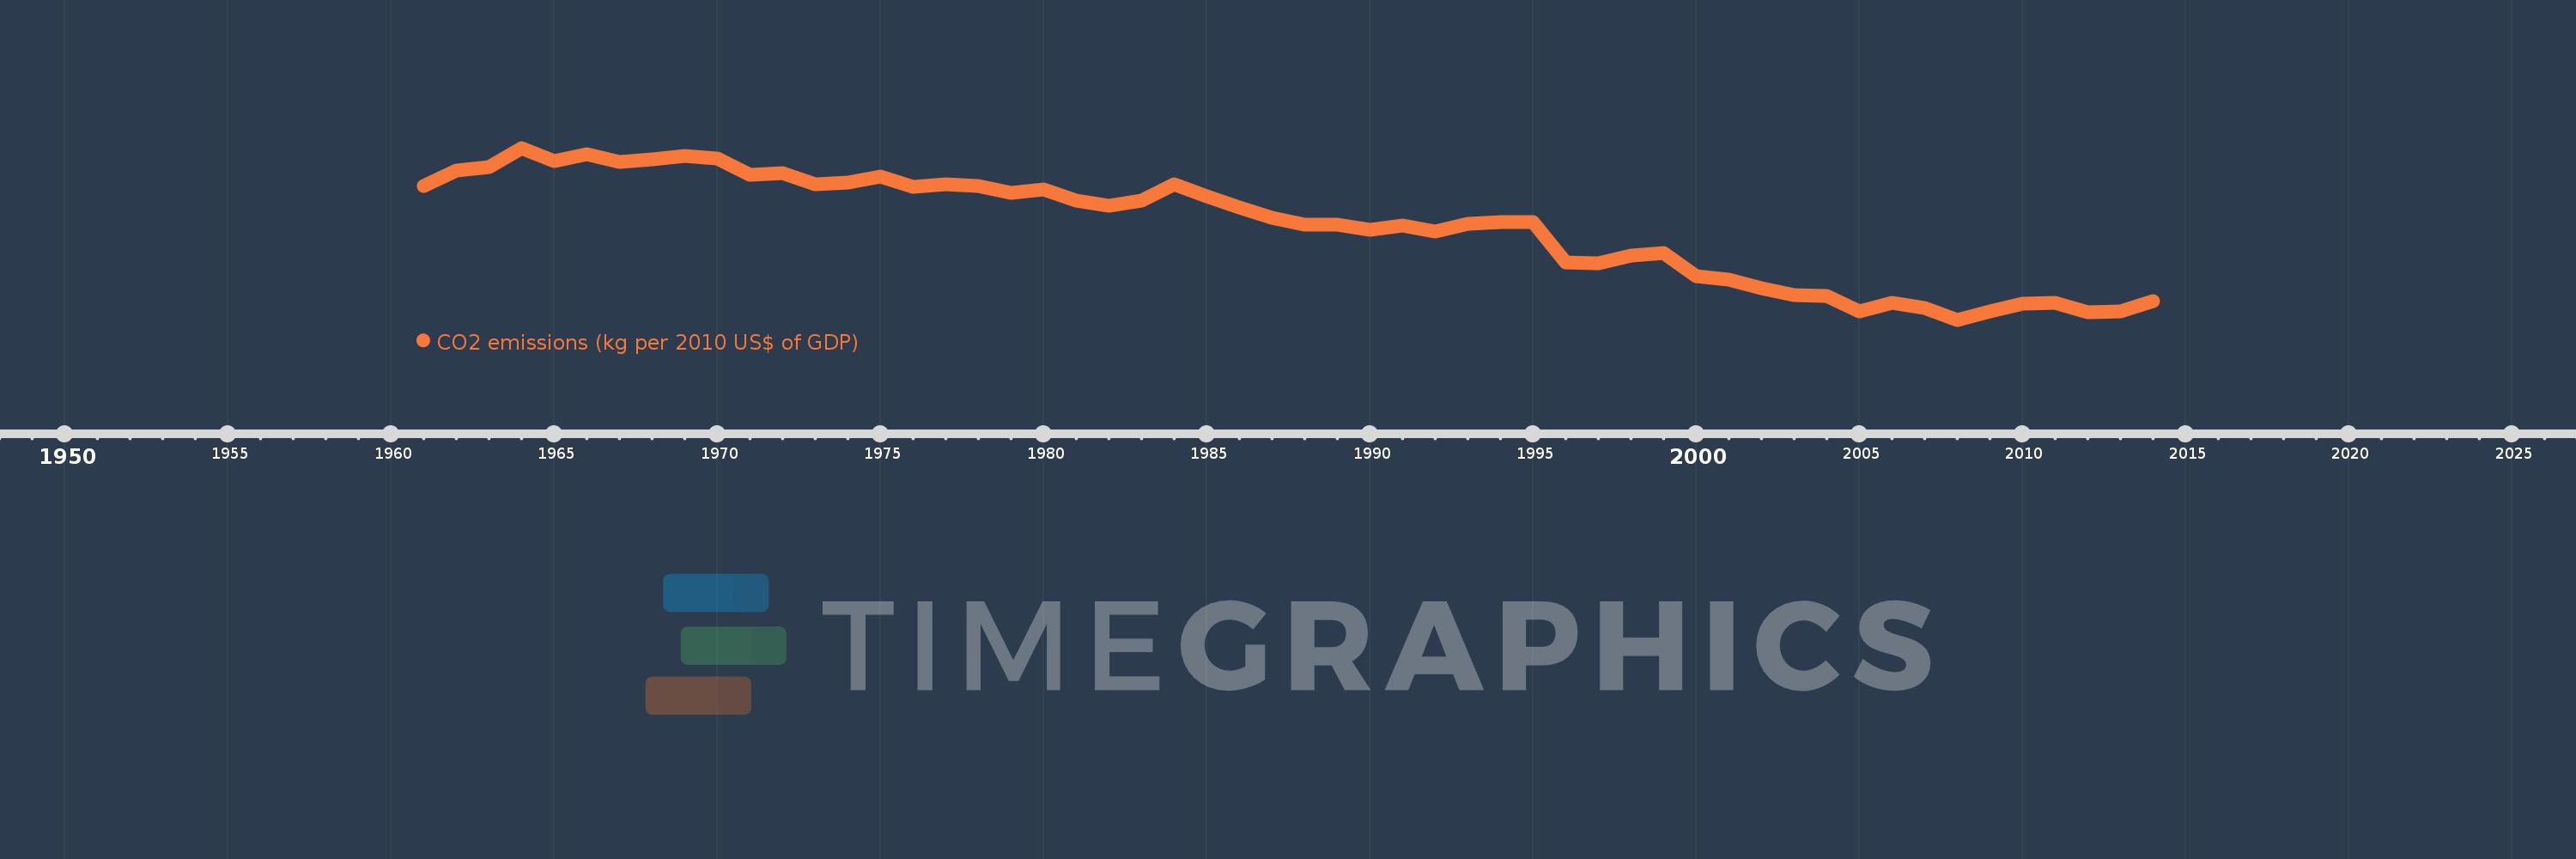
CO2 emissions (kg per 2010 US$ of GDP)
2014,2013,2012,2011,2010,2009,2008,2007,2006,2005,2004,2003,2002,2001,2000,1999,1998,1997,1996,1995,1994,1993,1992,1991,1990,1989,1988,1987,1986,1985,1984,1983,1982,1981,1980,1979,1978,1977,1976,1975,1974,1973,1972,1971,1970,1969,1968,1967,1966,1965,1964,1963,1962,1961
Estas estatísticas em outros países:
AfghanistanAlbaniaAlgeriaAndorraAngolaAntigua and BarbudaArab WorldArgentinaArmeniaArubaAustraliaAustriaAzerbaijanBahamas, TheBahrainBangladeshBarbadosBelarusBelgiumBelizeBeninBermudaBhutanBoliviaBosnia and HerzegovinaBotswanaBrazilBrunei DarussalamBulgariaBurkina FasoBurundiCabo VerdeCambodiaCameroonCanadaCaribbean small statesCentral African RepublicCentral Europe and the BalticsChadChileChinaColombiaComorosCongo, Dem. Rep.Congo, Rep.Costa RicaCote d'IvoireCroatiaCubaCyprusCzech RepublicDenmarkDjiboutiDominicaDominican RepublicEarly-demographic dividendEast Asia & PacificEast Asia & Pacific (excluding high income)East Asia & Pacific (IDA & IBRD countries)EcuadorEgypt, Arab Rep.El SalvadorEquatorial GuineaEritreaEstoniaEthiopiaEuro areaEurope & Central AsiaEurope & Central Asia (excluding high income)Europe & Central Asia (IDA & IBRD countries)European UnionFaroe IslandsFijiFinlandFragile and conflict affected situationsFranceGabonGambia, TheGeorgiaGermanyGhanaGreeceGreenlandGrenadaGuatemalaGuineaGuinea-BissauGuyanaHaitiHeavily indebted poor countries (HIPC)High incomeHondurasHong Kong SAR, ChinaHungaryIBRD onlyIcelandIDA & IBRD totalIDA blendIDA onlyIDA totalIndiaIndonesiaIran, Islamic Rep.IraqIrelandIsraelItalyJamaicaJapanJordanKazakhstanKenyaKiribatiKorea, Rep.KuwaitKyrgyz RepublicLao PDRLate-demographic dividendLatin America & Caribbean Latin America & Caribbean (excluding high income)Latin America & the Caribbean (IDA & IBRD countries)LatviaLeast developed countries: UN classificationLebanonLesothoLiberiaLibyaLiechtensteinLithuaniaLow & middle incomeLow incomeLower middle incomeLuxembourgMacao SAR, ChinaMacedonia, FYRMadagascarMalawiMalaysiaMaldivesMaliMaltaMarshall IslandsMauritaniaMauritiusMexicoMicronesia, Fed. Sts.Middle East & North AfricaMiddle East & North Africa (excluding high income)Middle East & North Africa (IDA & IBRD countries)Middle incomeMoldovaMongoliaMontenegroMoroccoMozambiqueMyanmarNamibiaNauruNepalNetherlandsNew ZealandNicaraguaNigerNigeriaNorth AmericaNorwayOECD membersOmanOther small statesPacific island small statesPakistanPalauPanamaPapua New GuineaParaguayPeruPhilippinesPolandPortugalPost-demographic dividendPre-demographic dividendQatarRomaniaRussian FederationRwandaSamoaSao Tome and PrincipeSaudi ArabiaSenegalSerbiaSeychellesSierra LeoneSingaporeSlovak RepublicSloveniaSmall statesSolomon IslandsSouth AfricaSouth AsiaSouth Asia (IDA & IBRD)South SudanSpainSri LankaSt. Kitts and NevisSt. LuciaSt. Vincent and the GrenadinesSub-Saharan Africa Sub-Saharan Africa (excluding high income)Sub-Saharan Africa (IDA & IBRD countries)SudanSurinameSwazilandSwedenSwitzerlandTajikistanTanzaniaThailandTimor-LesteTogoTongaTrinidad and TobagoTunisiaTurkeyTurkmenistanUgandaUkraineUnited Arab EmiratesUnited KingdomUnited StatesUpper middle incomeUruguayUzbekistanVanuatuVenezuela, RBVietnamWest Bank and GazaWorldYemen, Rep.ZambiaZimbabwe Linha do tempo:
Nesta escala de tempo está apresentado um gráfico de 1961 ano até 2014 ano Colombia. Dados de 1960 ano ausente. O número de observações reais por data: 54.
Fonte (nome):
Indicadores de desenvolvimento mundial
Fonte (organização):
Carbon Dioxide Information Analysis Center, Environmental Sciences Division, Oak Ridge National Laboratory, Tennessee, United States.
Categorias:
Climate Change, Environment
Foi atualizado:
23 abr 2017 ano
Indicadores de alterações dos valores ao longo dos anos
Mínimo:
0.238
1 jan 2008 ano
Máximo:
0.51
1 jan 1964 ano
Na data de observação
Valor
Mudança absoluta
A alteração em relação ao valor anterior
1 jan 1961 ano
0.45
+0.45
0.0%
1 jan 1962 ano
0.474
+0.025
5.46%
1 jan 1963 ano
0.48
+0.006
1.19%
1 jan 1964 ano
0.51
+0.03
6.25%
1 jan 1965 ano
0.489
-0.021
-4.2%
1 jan 1966 ano
0.5
+0.011
2.34%
1 jan 1967 ano
0.488
-0.012
-2.5%
1 jan 1968 ano
0.492
+0.005
0.93%
1 jan 1969 ano
0.498
+0.006
1.14%
1 jan 1970 ano
0.493
-0.005
-1.02%
1 jan 1971 ano
0.467
-0.026
-5.32%
1 jan 1972 ano
0.47
+0.004
0.77%
1 jan 1973 ano
0.453
-0.017
-3.59%
1 jan 1974 ano
0.455
+0.001
0.3%
1 jan 1975 ano
0.465
+0.011
2.37%
1 jan 1976 ano
0.448
-0.018
-3.76%
1 jan 1977 ano
0.453
+0.006
1.23%
1 jan 1978 ano
0.45
-0.004
-0.79%
1 jan 1979 ano
0.439
-0.011
-2.35%
1 jan 1980 ano
0.444
+0.005
1.15%
1 jan 1981 ano
0.426
-0.018
-4.1%
1 jan 1982 ano
0.418
-0.008
-1.99%
1 jan 1983 ano
0.427
+0.01
2.3%
1 jan 1984 ano
0.453
+0.026
6.02%
1 jan 1985 ano
0.434
-0.019
-4.16%
1 jan 1986 ano
0.416
-0.018
-4.19%
1 jan 1987 ano
0.399
-0.017
-4.11%
1 jan 1988 ano
0.389
-0.01
-2.42%
1 jan 1989 ano
0.388
-0.001
-0.17%
1 jan 1990 ano
0.381
-0.007
-1.85%
1 jan 1991 ano
0.387
+0.006
1.57%
1 jan 1992 ano
0.377
-0.01
-2.6%
1 jan 1993 ano
0.39
+0.013
3.42%
1 jan 1994 ano
0.393
+0.003
0.8%
1 jan 1995 ano
0.392
-0.001
-0.28%
1 jan 1996 ano
0.329
-0.063
-16.14%
1 jan 1997 ano
0.327
-0.002
-0.51%
1 jan 1998 ano
0.339
+0.012
3.68%
1 jan 1999 ano
0.343
+0.004
1.07%
1 jan 2000 ano
0.307
-0.036
-10.59%
1 jan 2001 ano
0.301
-0.006
-1.84%
1 jan 2002 ano
0.288
-0.013
-4.45%
1 jan 2003 ano
0.277
-0.01
-3.5%
1 jan 2004 ano
0.275
-0.002
-0.73%
1 jan 2005 ano
0.251
-0.025
-8.95%
1 jan 2006 ano
0.265
+0.014
5.69%
1 jan 2007 ano
0.257
-0.009
-3.21%
1 jan 2008 ano
0.238
-0.019
-7.21%
1 jan 2009 ano
0.251
+0.013
5.33%
1 jan 2010 ano
0.263
+0.012
4.98%
1 jan 2011 ano
0.265
+0.002
0.82%
1 jan 2012 ano
0.25
-0.015
-5.73%
1 jan 2013 ano
0.251
+0.001
0.31%
1 jan 2014 ano
0.268
+0.018
6.99%
Classificação de países por estatísticas atuais por anos


Comentários: