29
/it/
it
AIzaSyAYiBZKx7MnpbEhh9jyipgxe19OcubqV5w
April 1, 2024
99686
Cameroon
CMR
true
2
1
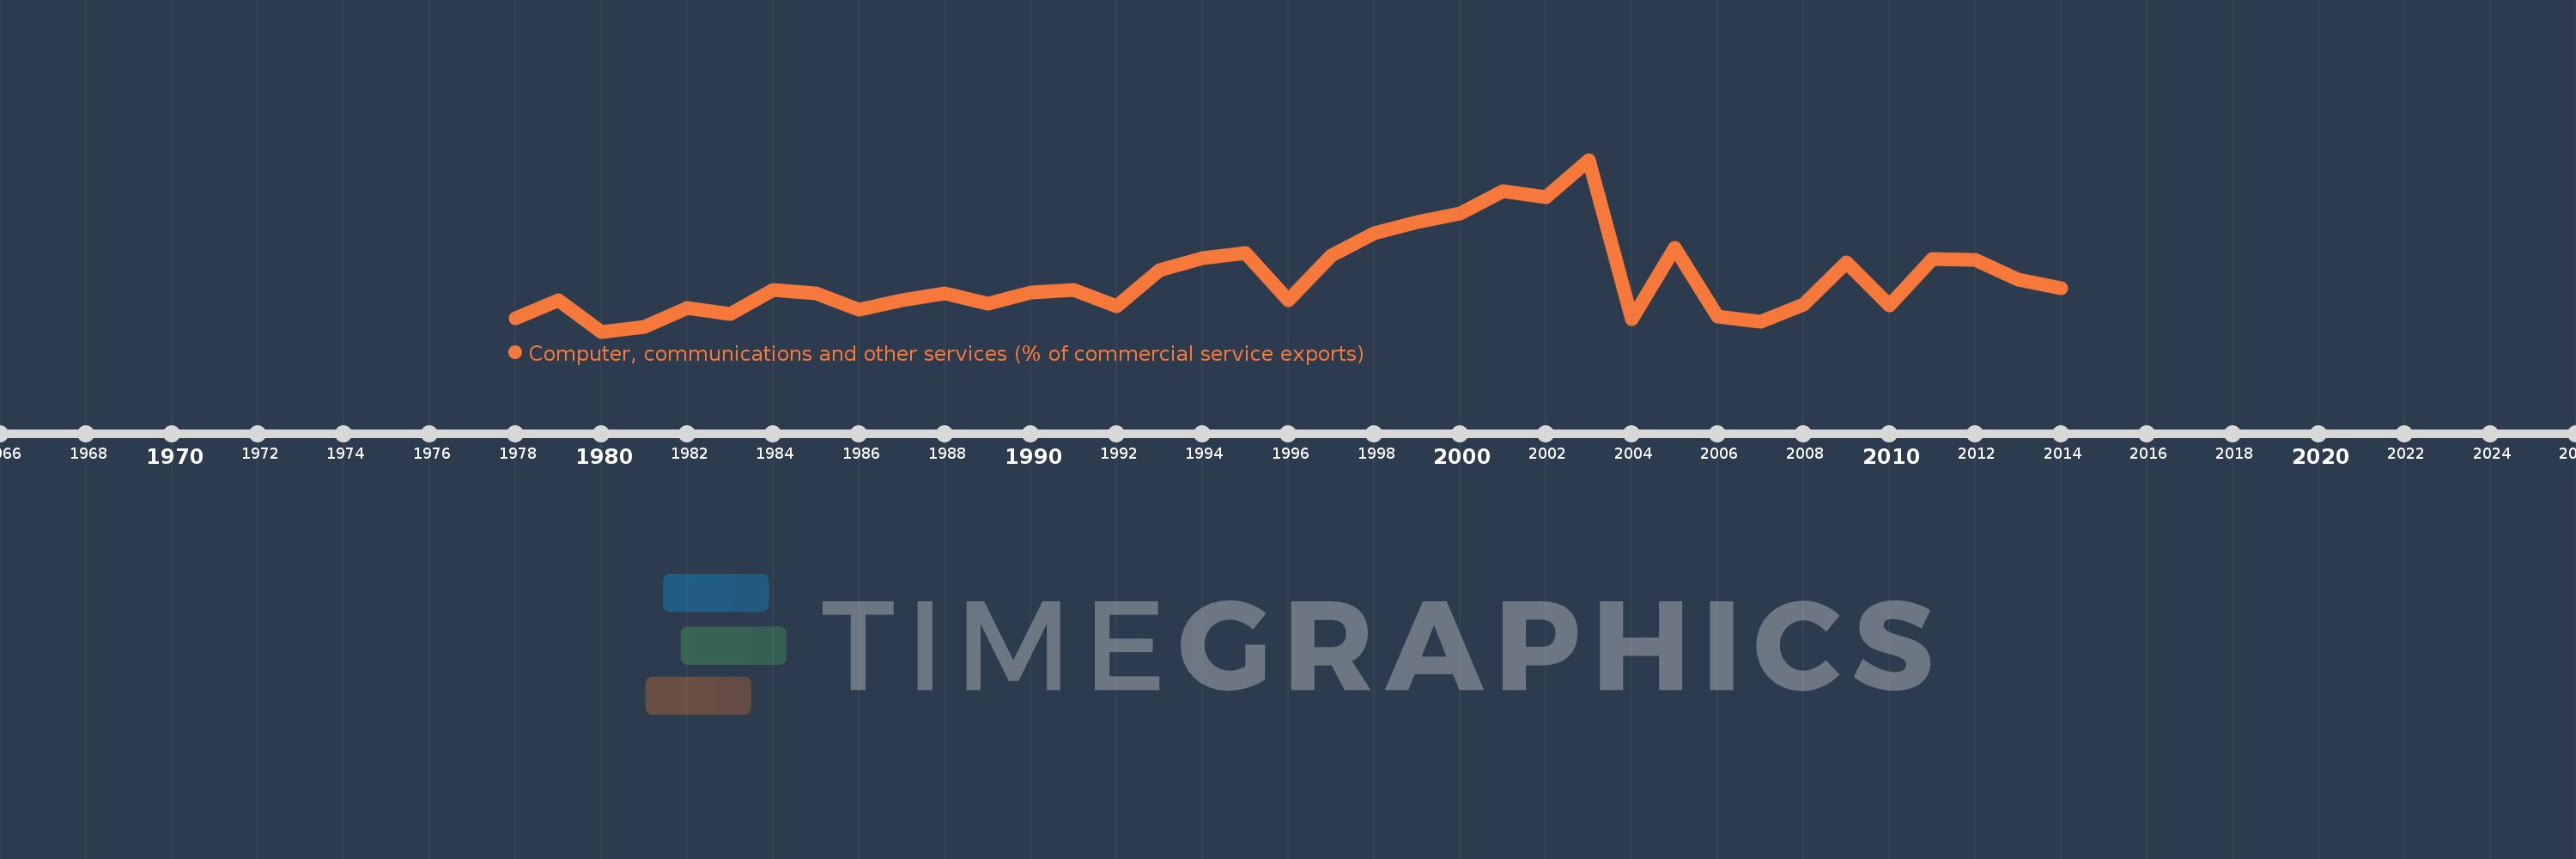
Computer, communications and other services (% of commercial service exports)
2014,2013,2012,2011,2010,2009,2008,2007,2006,2005,2004,2003,2002,2001,2000,1999,1998,1997,1996,1995,1994,1993,1992,1991,1990,1989,1988,1987,1986,1985,1984,1983,1982,1981,1980,1979,1978
Queste statistiche in altri paesi:
AfghanistanAlbaniaAlgeriaAngolaAntigua and BarbudaArab WorldArgentinaArmeniaArubaAustraliaAustriaAzerbaijanBahamas, TheBahrainBangladeshBarbadosBelarusBelgiumBelizeBeninBermudaBhutanBoliviaBosnia and HerzegovinaBotswanaBrazilBrunei DarussalamBulgariaBurkina FasoBurundiCabo VerdeCambodiaCameroonCanadaCaribbean small statesCentral African RepublicCentral Europe and the BalticsChadChileChinaColombiaComorosCongo, Dem. Rep.Congo, Rep.Costa RicaCote d'IvoireCroatiaCuracaoCyprusCzech RepublicDenmarkDjiboutiDominicaDominican RepublicEarly-demographic dividendEast Asia & PacificEast Asia & Pacific (excluding high income)East Asia & Pacific (IDA & IBRD countries)EcuadorEgypt, Arab Rep.El SalvadorEritreaEstoniaEthiopiaEuro areaEurope & Central AsiaEurope & Central Asia (excluding high income)Europe & Central Asia (IDA & IBRD countries)European UnionFaroe IslandsFijiFinlandFragile and conflict affected situationsFranceFrench PolynesiaGabonGambia, TheGeorgiaGermanyGhanaGreeceGrenadaGuatemalaGuineaGuinea-BissauGuyanaHaitiHeavily indebted poor countries (HIPC)High incomeHondurasHong Kong SAR, ChinaHungaryIBRD onlyIcelandIDA & IBRD totalIDA onlyIDA totalIndiaIndonesiaIran, Islamic Rep.IraqIrelandIsraelItalyJamaicaJapanJordanKazakhstanKenyaKiribatiKorea, Rep.KosovoKuwaitKyrgyz RepublicLao PDRLate-demographic dividendLatin America & Caribbean Latin America & Caribbean (excluding high income)Latin America & the Caribbean (IDA & IBRD countries)LatviaLeast developed countries: UN classificationLebanonLesothoLiberiaLibyaLithuaniaLow & middle incomeLow incomeLower middle incomeLuxembourgMacao SAR, ChinaMacedonia, FYRMadagascarMalawiMalaysiaMaldivesMaliMaltaMarshall IslandsMauritaniaMauritiusMexicoMicronesia, Fed. Sts.Middle East & North AfricaMiddle East & North Africa (excluding high income)Middle East & North Africa (IDA & IBRD countries)Middle incomeMoldovaMongoliaMontenegroMoroccoMozambiqueMyanmarNamibiaNepalNetherlandsNew CaledoniaNew ZealandNicaraguaNigerNigeriaNorth AmericaNorwayOECD membersOmanOther small statesPacific island small statesPakistanPalauPanamaPapua New GuineaParaguayPeruPhilippinesPolandPortugalPost-demographic dividendPre-demographic dividendQatarRomaniaRussian FederationRwandaSamoaSao Tome and PrincipeSaudi ArabiaSenegalSerbiaSeychellesSierra LeoneSingaporeSint Maarten (Dutch part)Slovak RepublicSloveniaSmall statesSolomon IslandsSouth AfricaSouth AsiaSouth Asia (IDA & IBRD)South SudanSpainSri LankaSt. Kitts and NevisSt. LuciaSt. Vincent and the GrenadinesSub-Saharan Africa Sub-Saharan Africa (excluding high income)Sub-Saharan Africa (IDA & IBRD countries)SudanSurinameSwazilandSwedenSwitzerlandSyrian Arab RepublicTajikistanTanzaniaThailandTimor-LesteTogoTongaTrinidad and TobagoTunisiaTurkeyTuvaluUgandaUkraineUnited KingdomUnited StatesUpper middle incomeUruguayVanuatuVenezuela, RBWest Bank and GazaWorldYemen, Rep.ZambiaZimbabwe Linea del tempo:
Questa scala temporale mostra un grafico dal 1978 anno al 2014 anno. Cameroon. I dati fino ad 1977 anno non disponibili. Il numero di osservazioni attuali secondo i date: 37.
La fonte (nome):
Indicatori dello sviluppo mondiale
La fonte (organizzazione):
International Monetary Fund, Balance of Payments Statistics Yearbook and data files.
Categorie:
Private Sector, Trade
sono stati aggiornati
23 apr 2017 anni
Indicatori delle variazioni dei valori per anni
Minima:
18.682
1 gen 1980 anni
Massimo:
79.799
1 gen 2003 anni
Alla data di osservazione
Valore
Variazione assoluta
La variazione rispetto al valore precedente
1 gen 1978 anni
23.301
+23.301
0.0%
1 gen 1979 anni
29.727
+6.427
27.58%
1 gen 1980 anni
18.682
-11.045
-37.16%
1 gen 1981 anni
20.438
+1.756
9.4%
1 gen 1982 anni
27.005
+6.568
32.13%
1 gen 1983 anni
24.853
-2.152
-7.97%
1 gen 1984 anni
33.636
+8.783
35.34%
1 gen 1985 anni
32.388
-1.248
-3.71%
1 gen 1986 anni
26.444
-5.944
-18.35%
1 gen 1987 anni
29.803
+3.359
12.7%
1 gen 1988 anni
32.229
+2.426
8.14%
1 gen 1989 anni
28.661
-3.568
-11.07%
1 gen 1990 anni
32.702
+4.041
14.1%
1 gen 1991 anni
33.619
+0.917
2.8%
1 gen 1992 anni
27.83
-5.789
-17.22%
1 gen 1993 anni
40.557
+12.727
45.73%
1 gen 1994 anni
44.671
+4.114
10.14%
1 gen 1995 anni
46.743
+2.071
4.64%
1 gen 1996 anni
29.71
-17.033
-36.44%
1 gen 1997 anni
45.603
+15.893
53.49%
1 gen 1998 anni
53.607
+8.005
17.55%
1 gen 1999 anni
57.552
+3.945
7.36%
1 gen 2000 anni
60.573
+3.021
5.25%
1 gen 2001 anni
68.775
+8.202
13.54%
1 gen 2002 anni
66.375
-2.4
-3.49%
1 gen 2003 anni
79.799
+13.424
20.22%
1 gen 2004 anni
23.25
-56.549
-70.86%
1 gen 2005 anni
48.614
+25.364
109.09%
1 gen 2006 anni
24.04
-24.574
-50.55%
1 gen 2007 anni
22.31
-1.73
-7.2%
1 gen 2008 anni
28.349
+6.039
27.07%
1 gen 2009 anni
43.4
+15.051
53.09%
1 gen 2010 anni
28.065
-15.335
-35.33%
1 gen 2011 anni
44.607
+16.542
58.94%
1 gen 2012 anni
44.318
-0.288
-0.65%
1 gen 2013 anni
37.307
-7.011
-15.82%
1 gen 2014 anni
34.028
-3.279
-8.79%
Classificazione dei paesi secondo i statistiche attuali per anni


Commenti: