29
/it/
it
AIzaSyAYiBZKx7MnpbEhh9jyipgxe19OcubqV5w
April 1, 2024
28950
East Asia & Pacific (IDA & IBRD countries)
TEA
false
2
1
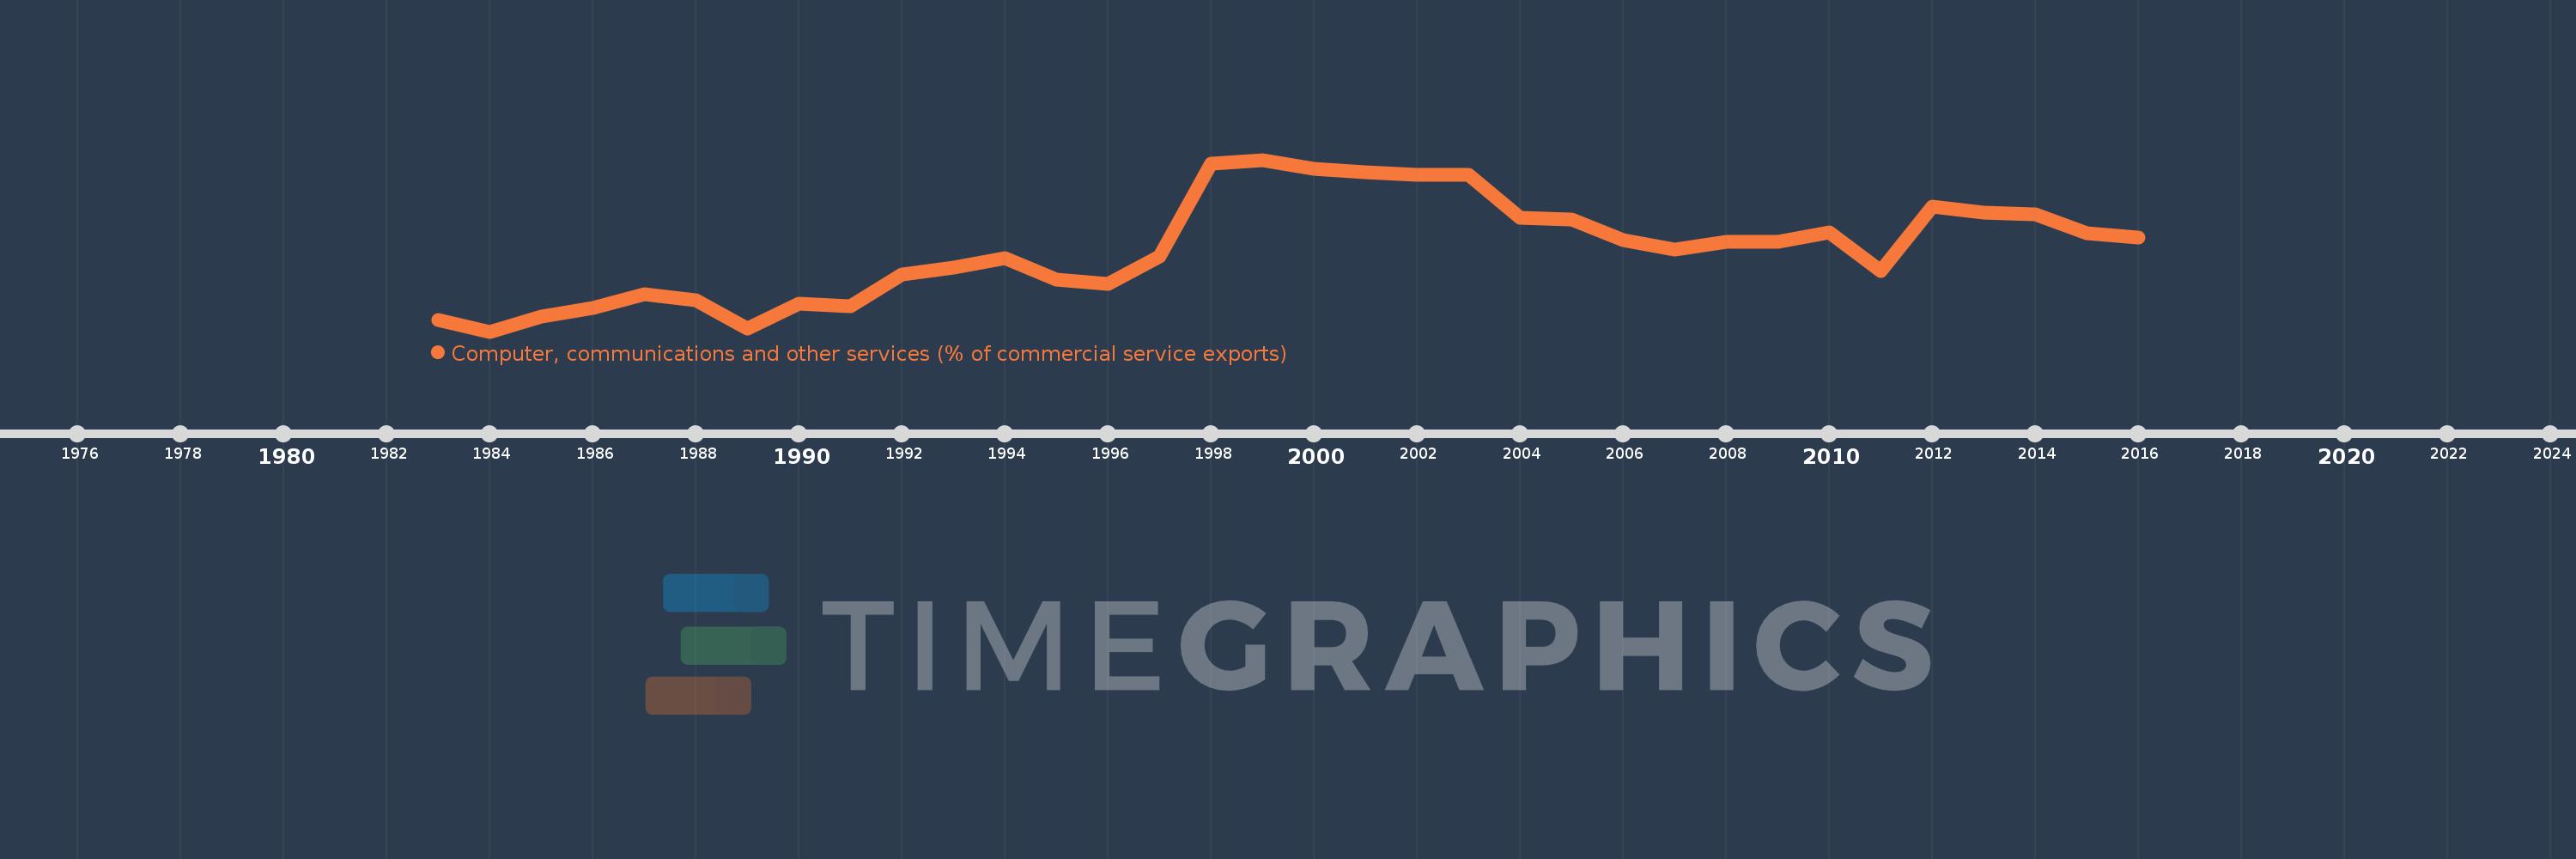
Computer, communications and other services (% of commercial service exports)
2016,2015,2014,2013,2012,2011,2010,2009,2008,2007,2006,2005,2004,2003,2002,2001,2000,1999,1998,1997,1996,1995,1994,1993,1992,1991,1990,1989,1988,1987,1986,1985,1984,1983
Queste statistiche in altri paesi:
AfghanistanAlbaniaAlgeriaAngolaAntigua and BarbudaArab WorldArgentinaArmeniaArubaAustraliaAustriaAzerbaijanBahamas, TheBahrainBangladeshBarbadosBelarusBelgiumBelizeBeninBermudaBhutanBoliviaBosnia and HerzegovinaBotswanaBrazilBrunei DarussalamBulgariaBurkina FasoBurundiCabo VerdeCambodiaCameroonCanadaCaribbean small statesCentral African RepublicCentral Europe and the BalticsChadChileChinaColombiaComorosCongo, Dem. Rep.Congo, Rep.Costa RicaCote d'IvoireCroatiaCuracaoCyprusCzech RepublicDenmarkDjiboutiDominicaDominican RepublicEarly-demographic dividendEast Asia & PacificEast Asia & Pacific (excluding high income)East Asia & Pacific (IDA & IBRD countries)EcuadorEgypt, Arab Rep.El SalvadorEritreaEstoniaEthiopiaEuro areaEurope & Central AsiaEurope & Central Asia (excluding high income)Europe & Central Asia (IDA & IBRD countries)European UnionFaroe IslandsFijiFinlandFragile and conflict affected situationsFranceFrench PolynesiaGabonGambia, TheGeorgiaGermanyGhanaGreeceGrenadaGuatemalaGuineaGuinea-BissauGuyanaHaitiHeavily indebted poor countries (HIPC)High incomeHondurasHong Kong SAR, ChinaHungaryIBRD onlyIcelandIDA & IBRD totalIDA onlyIDA totalIndiaIndonesiaIran, Islamic Rep.IraqIrelandIsraelItalyJamaicaJapanJordanKazakhstanKenyaKiribatiKorea, Rep.KosovoKuwaitKyrgyz RepublicLao PDRLate-demographic dividendLatin America & Caribbean Latin America & Caribbean (excluding high income)Latin America & the Caribbean (IDA & IBRD countries)LatviaLeast developed countries: UN classificationLebanonLesothoLiberiaLibyaLithuaniaLow & middle incomeLow incomeLower middle incomeLuxembourgMacao SAR, ChinaMacedonia, FYRMadagascarMalawiMalaysiaMaldivesMaliMaltaMarshall IslandsMauritaniaMauritiusMexicoMicronesia, Fed. Sts.Middle East & North AfricaMiddle East & North Africa (excluding high income)Middle East & North Africa (IDA & IBRD countries)Middle incomeMoldovaMongoliaMontenegroMoroccoMozambiqueMyanmarNamibiaNepalNetherlandsNew CaledoniaNew ZealandNicaraguaNigerNigeriaNorth AmericaNorwayOECD membersOmanOther small statesPacific island small statesPakistanPalauPanamaPapua New GuineaParaguayPeruPhilippinesPolandPortugalPost-demographic dividendPre-demographic dividendQatarRomaniaRussian FederationRwandaSamoaSao Tome and PrincipeSaudi ArabiaSenegalSerbiaSeychellesSierra LeoneSingaporeSint Maarten (Dutch part)Slovak RepublicSloveniaSmall statesSolomon IslandsSouth AfricaSouth AsiaSouth Asia (IDA & IBRD)South SudanSpainSri LankaSt. Kitts and NevisSt. LuciaSt. Vincent and the GrenadinesSub-Saharan Africa Sub-Saharan Africa (excluding high income)Sub-Saharan Africa (IDA & IBRD countries)SudanSurinameSwazilandSwedenSwitzerlandSyrian Arab RepublicTajikistanTanzaniaThailandTimor-LesteTogoTongaTrinidad and TobagoTunisiaTurkeyTuvaluUgandaUkraineUnited KingdomUnited StatesUpper middle incomeUruguayVanuatuVenezuela, RBWest Bank and GazaWorldYemen, Rep.ZambiaZimbabwe Linea del tempo:
Questa scala temporale mostra un grafico dal 1983 anno al 2016 anno. East Asia & Pacific (IDA & IBRD countries). I dati fino ad 1982 anno non disponibili. Il numero di osservazioni attuali secondo i date: 34.
La fonte (nome):
Indicatori dello sviluppo mondiale
La fonte (organizzazione):
International Monetary Fund, Balance of Payments Statistics Yearbook and data files.
Categorie:
Private Sector, Trade
sono stati aggiornati
23 apr 2017 anni
Indicatori delle variazioni dei valori per anni
Minima:
11.561
1 gen 1984 anni
Massimo:
64.633
1 gen 1999 anni
Alla data di osservazione
Valore
Variazione assoluta
La variazione rispetto al valore precedente
1 gen 1983 anni
15.274
+15.274
0.0%
1 gen 1984 anni
11.561
-3.713
-24.31%
1 gen 1985 anni
16.127
+4.566
39.5%
1 gen 1986 anni
18.862
+2.735
16.96%
1 gen 1987 anni
23.212
+4.35
23.06%
1 gen 1988 anni
21.294
-1.918
-8.26%
1 gen 1989 anni
12.573
-8.721
-40.96%
1 gen 1990 anni
20.23
+7.658
60.91%
1 gen 1991 anni
19.498
-0.733
-3.62%
1 gen 1992 anni
29.209
+9.711
49.81%
1 gen 1993 anni
31.411
+2.203
7.54%
1 gen 1994 anni
34.161
+2.749
8.75%
1 gen 1995 anni
27.585
-6.576
-19.25%
1 gen 1996 anni
26.405
-1.18
-4.28%
1 gen 1997 anni
34.865
+8.46
32.04%
1 gen 1998 anni
63.509
+28.644
82.16%
1 gen 1999 anni
64.633
+1.124
1.77%
1 gen 2000 anni
61.92
-2.713
-4.2%
1 gen 2001 anni
60.767
-1.153
-1.86%
1 gen 2002 anni
59.877
-0.89
-1.47%
1 gen 2003 anni
60.071
+0.194
0.32%
1 gen 2004 anni
46.825
-13.246
-22.05%
1 gen 2005 anni
46.217
-0.608
-1.3%
1 gen 2006 anni
39.815
-6.403
-13.85%
1 gen 2007 anni
36.924
-2.89
-7.26%
1 gen 2008 anni
39.392
+2.467
6.68%
1 gen 2009 anni
39.422
+0.03
0.08%
1 gen 2010 anni
42.126
+2.704
6.86%
1 gen 2011 anni
30.312
-11.814
-28.04%
1 gen 2012 anni
50.144
+19.831
65.42%
1 gen 2013 anni
48.246
-1.898
-3.79%
1 gen 2014 anni
47.849
-0.396
-0.82%
1 gen 2015 anni
41.844
-6.006
-12.55%
1 gen 2016 anni
40.616
-1.228
-2.93%
Classificazione dei paesi secondo i statistiche attuali per anni


Commenti: