29
/it/
it
AIzaSyAYiBZKx7MnpbEhh9jyipgxe19OcubqV5w
April 1, 2024
78002
Bangladesh
BGD
true
2
1
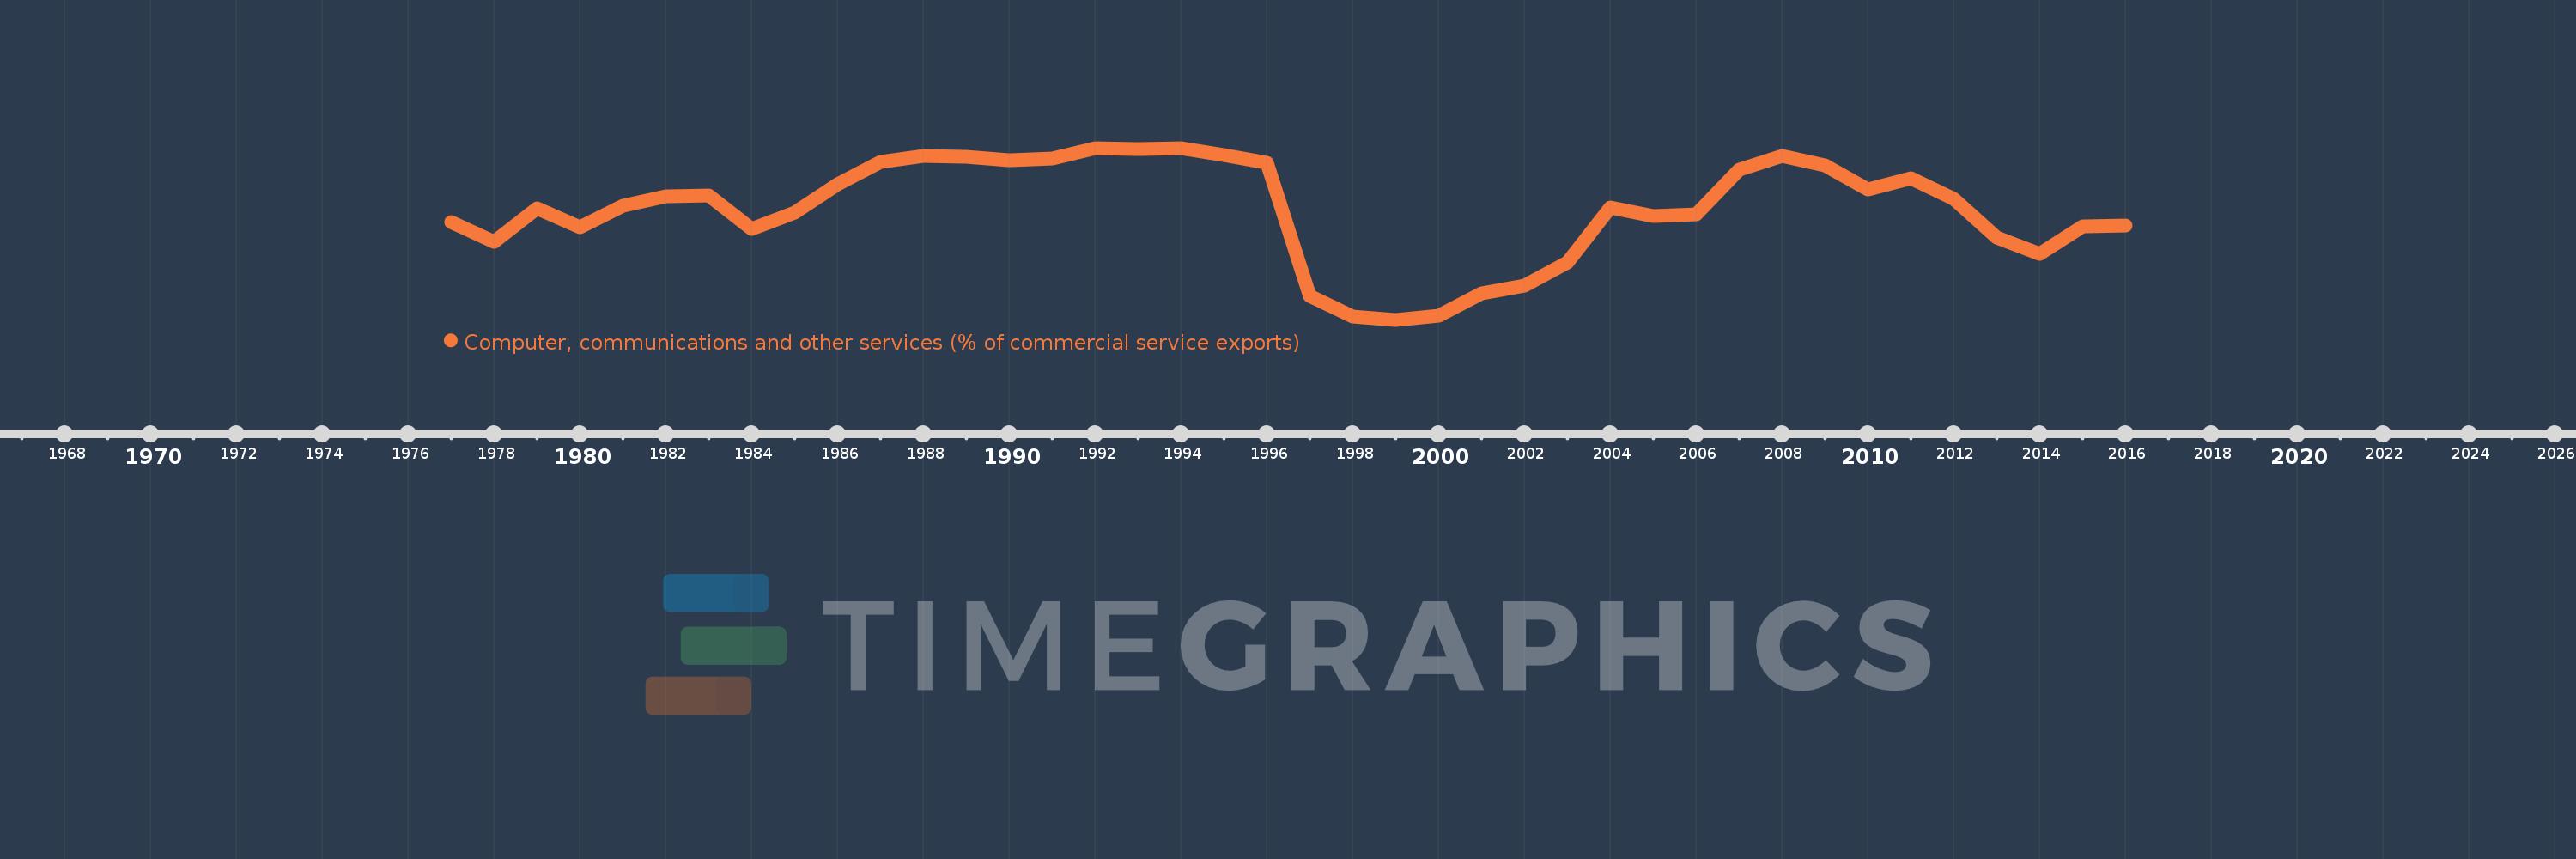
Computer, communications and other services (% of commercial service exports)
2016,2015,2014,2013,2012,2011,2010,2009,2008,2007,2006,2005,2004,2003,2002,2001,2000,1999,1998,1997,1996,1995,1994,1993,1992,1991,1990,1989,1988,1987,1986,1985,1984,1983,1982,1981,1980,1979,1978,1977
Queste statistiche in altri paesi:
AfghanistanAlbaniaAlgeriaAngolaAntigua and BarbudaArab WorldArgentinaArmeniaArubaAustraliaAustriaAzerbaijanBahamas, TheBahrainBangladeshBarbadosBelarusBelgiumBelizeBeninBermudaBhutanBoliviaBosnia and HerzegovinaBotswanaBrazilBrunei DarussalamBulgariaBurkina FasoBurundiCabo VerdeCambodiaCameroonCanadaCaribbean small statesCentral African RepublicCentral Europe and the BalticsChadChileChinaColombiaComorosCongo, Dem. Rep.Congo, Rep.Costa RicaCote d'IvoireCroatiaCuracaoCyprusCzech RepublicDenmarkDjiboutiDominicaDominican RepublicEarly-demographic dividendEast Asia & PacificEast Asia & Pacific (excluding high income)East Asia & Pacific (IDA & IBRD countries)EcuadorEgypt, Arab Rep.El SalvadorEritreaEstoniaEthiopiaEuro areaEurope & Central AsiaEurope & Central Asia (excluding high income)Europe & Central Asia (IDA & IBRD countries)European UnionFaroe IslandsFijiFinlandFragile and conflict affected situationsFranceFrench PolynesiaGabonGambia, TheGeorgiaGermanyGhanaGreeceGrenadaGuatemalaGuineaGuinea-BissauGuyanaHaitiHeavily indebted poor countries (HIPC)High incomeHondurasHong Kong SAR, ChinaHungaryIBRD onlyIcelandIDA & IBRD totalIDA onlyIDA totalIndiaIndonesiaIran, Islamic Rep.IraqIrelandIsraelItalyJamaicaJapanJordanKazakhstanKenyaKiribatiKorea, Rep.KosovoKuwaitKyrgyz RepublicLao PDRLate-demographic dividendLatin America & Caribbean Latin America & Caribbean (excluding high income)Latin America & the Caribbean (IDA & IBRD countries)LatviaLeast developed countries: UN classificationLebanonLesothoLiberiaLibyaLithuaniaLow & middle incomeLow incomeLower middle incomeLuxembourgMacao SAR, ChinaMacedonia, FYRMadagascarMalawiMalaysiaMaldivesMaliMaltaMarshall IslandsMauritaniaMauritiusMexicoMicronesia, Fed. Sts.Middle East & North AfricaMiddle East & North Africa (excluding high income)Middle East & North Africa (IDA & IBRD countries)Middle incomeMoldovaMongoliaMontenegroMoroccoMozambiqueMyanmarNamibiaNepalNetherlandsNew CaledoniaNew ZealandNicaraguaNigerNigeriaNorth AmericaNorwayOECD membersOmanOther small statesPacific island small statesPakistanPalauPanamaPapua New GuineaParaguayPeruPhilippinesPolandPortugalPost-demographic dividendPre-demographic dividendQatarRomaniaRussian FederationRwandaSamoaSao Tome and PrincipeSaudi ArabiaSenegalSerbiaSeychellesSierra LeoneSingaporeSint Maarten (Dutch part)Slovak RepublicSloveniaSmall statesSolomon IslandsSouth AfricaSouth AsiaSouth Asia (IDA & IBRD)South SudanSpainSri LankaSt. Kitts and NevisSt. LuciaSt. Vincent and the GrenadinesSub-Saharan Africa Sub-Saharan Africa (excluding high income)Sub-Saharan Africa (IDA & IBRD countries)SudanSurinameSwazilandSwedenSwitzerlandSyrian Arab RepublicTajikistanTanzaniaThailandTimor-LesteTogoTongaTrinidad and TobagoTunisiaTurkeyTuvaluUgandaUkraineUnited KingdomUnited StatesUpper middle incomeUruguayVanuatuVenezuela, RBWest Bank and GazaWorldYemen, Rep.ZambiaZimbabwe Linea del tempo:
Questa scala temporale mostra un grafico dal 1977 anno al 2016 anno. Bangladesh. I dati fino ad 1976 anno non disponibili. Il numero di osservazioni attuali secondo i date: 40.
La fonte (nome):
Indicatori dello sviluppo mondiale
La fonte (organizzazione):
International Monetary Fund, Balance of Payments Statistics Yearbook and data files.
Categorie:
Private Sector, Trade
sono stati aggiornati
23 apr 2017 anni
Indicatori delle variazioni dei valori per anni
Minima:
37.021
1 gen 1999 anni
Massimo:
83.564
1 gen 1992 anni
Alla data di osservazione
Valore
Variazione assoluta
La variazione rispetto al valore precedente
1 gen 1977 anni
63.583
+63.583
0.0%
1 gen 1978 anni
58.18
-5.403
-8.5%
1 gen 1979 anni
67.113
+8.933
15.35%
1 gen 1980 anni
62.001
-5.112
-7.62%
1 gen 1981 anni
67.937
+5.935
9.57%
1 gen 1982 anni
70.528
+2.591
3.81%
1 gen 1983 anni
70.704
+0.176
0.25%
1 gen 1984 anni
61.603
-9.1
-12.87%
1 gen 1985 anni
66.002
+4.399
7.14%
1 gen 1986 anni
73.775
+7.773
11.78%
1 gen 1987 anni
79.783
+6.008
8.14%
1 gen 1988 anni
81.344
+1.561
1.96%
1 gen 1989 anni
81.205
-0.139
-0.17%
1 gen 1990 anni
80.324
-0.881
-1.09%
1 gen 1991 anni
80.589
+0.265
0.33%
1 gen 1992 anni
83.564
+2.976
3.69%
1 gen 1993 anni
83.187
-0.377
-0.45%
1 gen 1994 anni
83.416
+0.229
0.28%
1 gen 1995 anni
81.625
-1.792
-2.15%
1 gen 1996 anni
79.58
-2.044
-2.5%
1 gen 1997 anni
43.537
-36.044
-45.29%
1 gen 1998 anni
37.766
-5.77
-13.25%
1 gen 1999 anni
37.021
-0.746
-1.97%
1 gen 2000 anni
38.191
+1.17
3.16%
1 gen 2001 anni
44.216
+6.025
15.78%
1 gen 2002 anni
46.239
+2.023
4.58%
1 gen 2003 anni
52.656
+6.417
13.88%
1 gen 2004 anni
67.341
+14.685
27.89%
1 gen 2005 anni
65.137
-2.204
-3.27%
1 gen 2006 anni
65.617
+0.48
0.74%
1 gen 2007 anni
77.597
+11.98
18.26%
1 gen 2008 anni
81.292
+3.695
4.76%
1 gen 2009 anni
78.752
-2.54
-3.12%
1 gen 2010 anni
72.225
-6.527
-8.29%
1 gen 2011 anni
75.356
+3.131
4.34%
1 gen 2012 anni
69.733
-5.623
-7.46%
1 gen 2013 anni
59.19
-10.543
-15.12%
1 gen 2014 anni
54.909
-4.281
-7.23%
1 gen 2015 anni
62.324
+7.415
13.5%
1 gen 2016 anni
62.451
+0.127
0.2%
Classificazione dei paesi secondo i statistiche attuali per anni


Commenti: