29
/it/
it
AIzaSyAYiBZKx7MnpbEhh9jyipgxe19OcubqV5w
April 1, 2024
96992
Cabo Verde
CPV
true
2
1
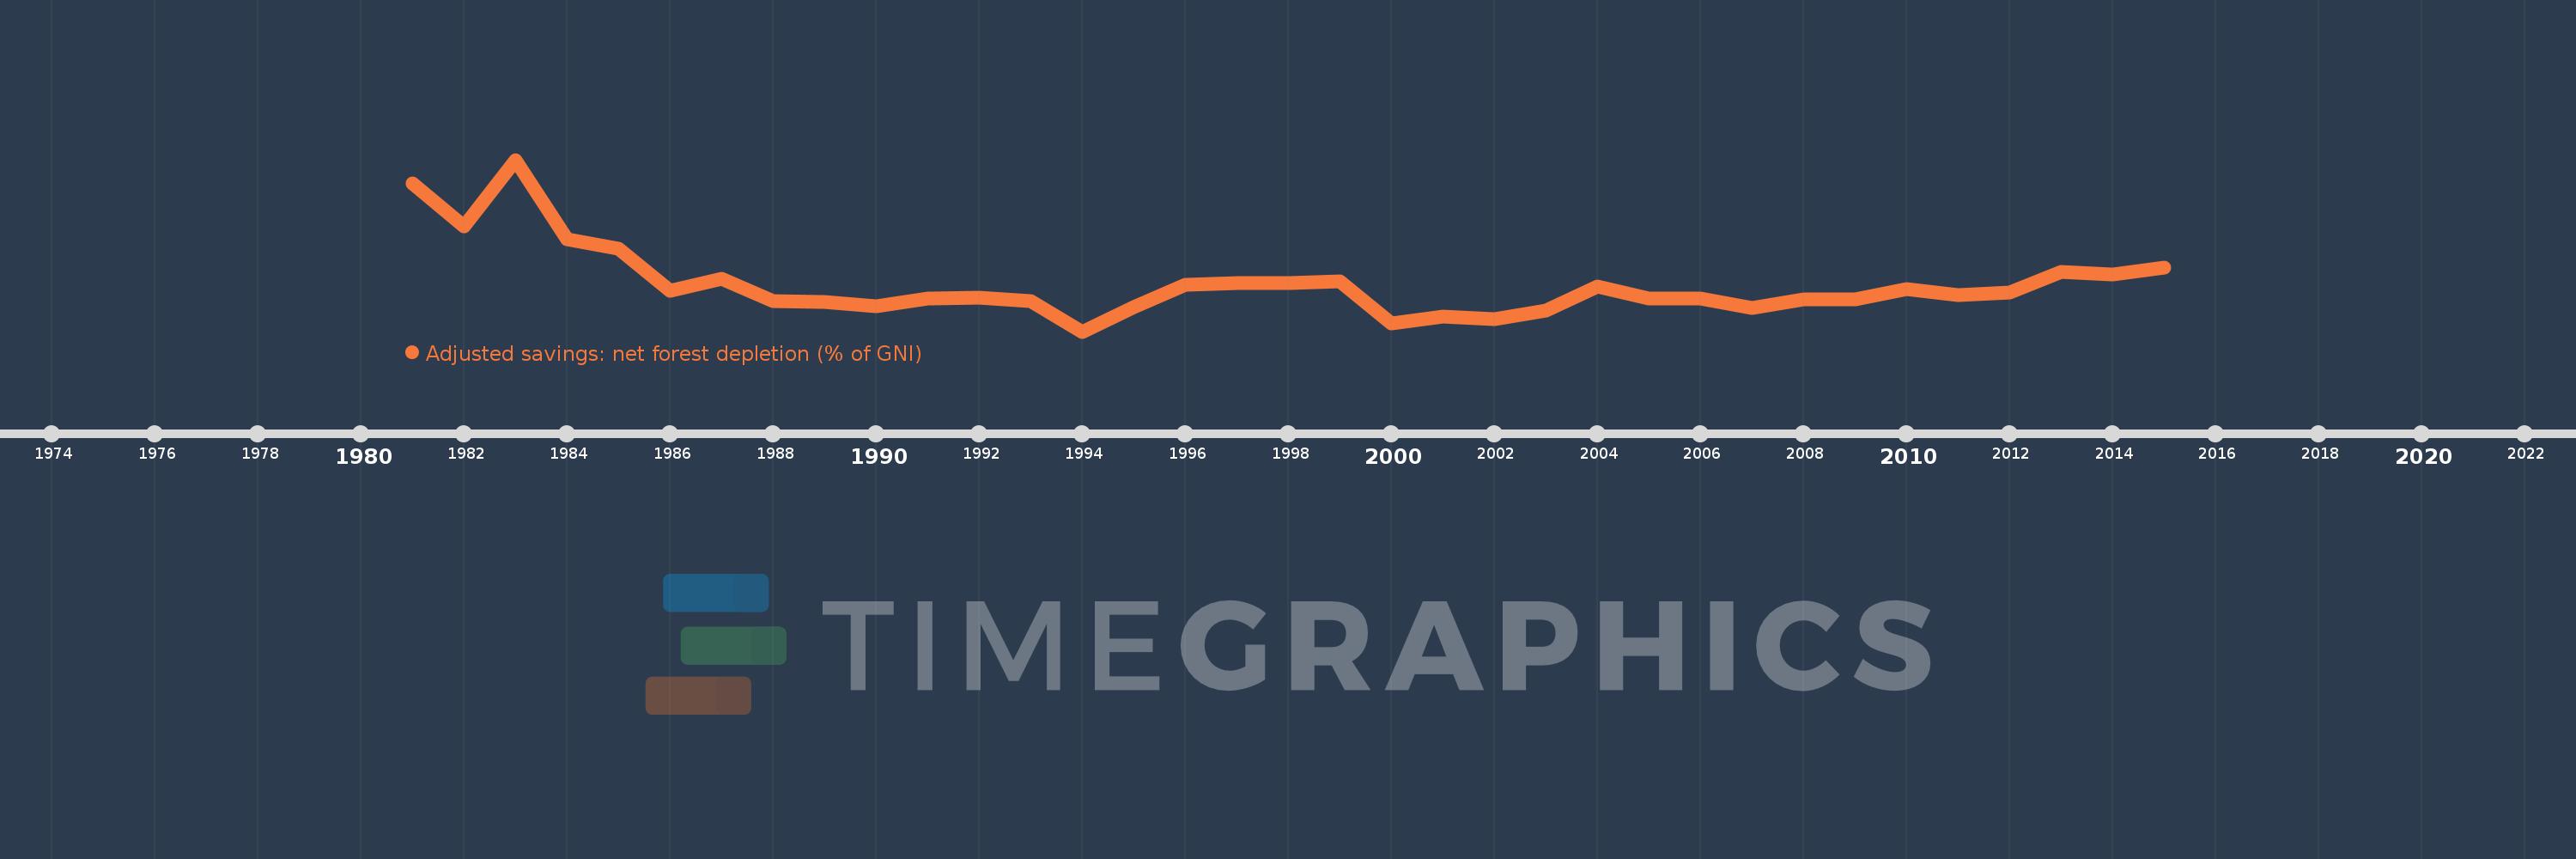
Adjusted savings: net forest depletion (% of GNI)
2015,2014,2013,2012,2011,2010,2009,2008,2007,2006,2005,2004,2003,2002,2001,2000,1999,1998,1997,1996,1995,1994,1993,1992,1991,1990,1989,1988,1987,1986,1985,1984,1983,1982,1981
Queste statistiche in altri paesi:
AfghanistanAlbaniaAlgeriaAngolaArab WorldArgentinaArmeniaAustraliaAustriaAzerbaijanBahamas, TheBahrainBangladeshBarbadosBelarusBelgiumBelizeBeninBhutanBoliviaBotswanaBrazilBrunei DarussalamBulgariaBurkina FasoBurundiCabo VerdeCambodiaCameroonCanadaCaribbean small statesCentral African RepublicCentral Europe and the BalticsChadChileChinaColombiaComorosCongo, Dem. Rep.Congo, Rep.Costa RicaCote d'IvoireCroatiaCubaCyprusCzech RepublicDenmarkDjiboutiDominicaDominican RepublicEarly-demographic dividendEast Asia & PacificEast Asia & Pacific (excluding high income)East Asia & Pacific (IDA & IBRD countries)EcuadorEgypt, Arab Rep.El SalvadorEquatorial GuineaEritreaEstoniaEthiopiaEuro areaEurope & Central AsiaEurope & Central Asia (excluding high income)Europe & Central Asia (IDA & IBRD countries)European UnionFijiFinlandFragile and conflict affected situationsFranceFrench PolynesiaGabonGambia, TheGeorgiaGermanyGhanaGreeceGuatemalaGuineaGuinea-BissauGuyanaHaitiHeavily indebted poor countries (HIPC)High incomeHondurasHong Kong SAR, ChinaHungaryIBRD onlyIcelandIDA & IBRD totalIDA blendIDA onlyIDA totalIndiaIndonesiaIran, Islamic Rep.IraqIrelandIsraelItalyJamaicaJapanJordanKazakhstanKenyaKiribatiKorea, Rep.KuwaitKyrgyz RepublicLao PDRLate-demographic dividendLatin America & Caribbean Latin America & Caribbean (excluding high income)Latin America & the Caribbean (IDA & IBRD countries)LatviaLeast developed countries: UN classificationLebanonLesothoLiberiaLibyaLithuaniaLow & middle incomeLow incomeLower middle incomeLuxembourgMacedonia, FYRMadagascarMalawiMalaysiaMaldivesMaliMauritaniaMauritiusMexicoMicronesia, Fed. Sts.Middle East & North AfricaMiddle East & North Africa (excluding high income)Middle East & North Africa (IDA & IBRD countries)Middle incomeMoldovaMongoliaMoroccoMozambiqueMyanmarNamibiaNepalNetherlandsNew CaledoniaNew ZealandNicaraguaNigerNigeriaNorth AmericaNorwayOECD membersOmanOther small statesPacific island small statesPakistanPanamaPapua New GuineaParaguayPeruPhilippinesPolandPortugalPost-demographic dividendPre-demographic dividendQatarRomaniaRussian FederationRwandaSamoaSao Tome and PrincipeSaudi ArabiaSenegalSeychellesSierra LeoneSingaporeSlovak RepublicSloveniaSmall statesSolomon IslandsSomaliaSouth AfricaSouth AsiaSouth Asia (IDA & IBRD)SpainSri LankaSt. LuciaSt. Vincent and the GrenadinesSub-Saharan Africa Sub-Saharan Africa (excluding high income)Sub-Saharan Africa (IDA & IBRD countries)SudanSurinameSwazilandSwedenSwitzerlandSyrian Arab RepublicTajikistanTanzaniaThailandTogoTongaTrinidad and TobagoTunisiaTurkeyTurkmenistanUgandaUkraineUnited Arab EmiratesUnited KingdomUnited StatesUpper middle incomeUruguayUzbekistanVanuatuVenezuela, RBVietnamWorldYemen, Rep.ZambiaZimbabwe Linea del tempo:
Questa scala temporale mostra un grafico dal 1981 anno al 2015 anno. Cabo Verde. I dati fino ad 1980 anno non disponibili. Il numero di osservazioni attuali secondo i date: 35.
La fonte (nome):
Indicatori dello sviluppo mondiale
La fonte (organizzazione):
World Bank staff estimates based on sources and methods in World Bank's "The Changing Wealth of Nations: Measuring Sustainable Development in the New Millennium" (2011).
Categorie:
Economy & Growth, Environment
sono stati aggiornati
23 apr 2017 anni
Indicatori delle variazioni dei valori per anni
Minima:
0.171
1 gen 1994 anni
Massimo:
0.924
1 gen 1983 anni
Alla data di osservazione
Valore
Variazione assoluta
La variazione rispetto al valore precedente
1 gen 1981 anni
0.822
+0.822
0.0%
1 gen 1982 anni
0.632
-0.191
-23.2%
1 gen 1983 anni
0.924
+0.293
46.35%
1 gen 1984 anni
0.574
-0.35
-37.9%
1 gen 1985 anni
0.533
-0.041
-7.21%
1 gen 1986 anni
0.348
-0.184
-34.59%
1 gen 1987 anni
0.401
+0.052
14.96%
1 gen 1988 anni
0.305
-0.095
-23.79%
1 gen 1989 anni
0.3
-0.005
-1.67%
1 gen 1990 anni
0.282
-0.018
-6.11%
1 gen 1991 anni
0.315
+0.033
11.72%
1 gen 1992 anni
0.321
+0.006
1.97%
1 gen 1993 anni
0.303
-0.018
-5.58%
1 gen 1994 anni
0.171
-0.132
-43.63%
1 gen 1995 anni
0.28
+0.109
63.71%
1 gen 1996 anni
0.378
+0.098
35.05%
1 gen 1997 anni
0.385
+0.007
1.88%
1 gen 1998 anni
0.384
-0.001
-0.28%
1 gen 1999 anni
0.392
+0.008
2.17%
1 gen 2000 anni
0.206
-0.186
-47.49%
1 gen 2001 anni
0.236
+0.03
14.51%
1 gen 2002 anni
0.227
-0.009
-3.69%
1 gen 2003 anni
0.265
+0.038
16.61%
1 gen 2004 anni
0.37
+0.105
39.6%
1 gen 2005 anni
0.315
-0.055
-14.92%
1 gen 2006 anni
0.315
+0.0
0.05%
1 gen 2007 anni
0.275
-0.04
-12.63%
1 gen 2008 anni
0.313
+0.038
13.88%
1 gen 2009 anni
0.312
-0.001
-0.34%
1 gen 2010 anni
0.358
+0.046
14.76%
1 gen 2011 anni
0.331
-0.027
-7.48%
1 gen 2012 anni
0.343
+0.012
3.47%
1 gen 2013 anni
0.434
+0.092
26.7%
1 gen 2014 anni
0.423
-0.012
-2.65%
1 gen 2015 anni
0.451
+0.028
6.61%
Classificazione dei paesi secondo i statistiche attuali per anni


Commenti: