29
/it/
it
AIzaSyAYiBZKx7MnpbEhh9jyipgxe19OcubqV5w
April 1, 2024
143950
Guatemala
GTM
true
2
1
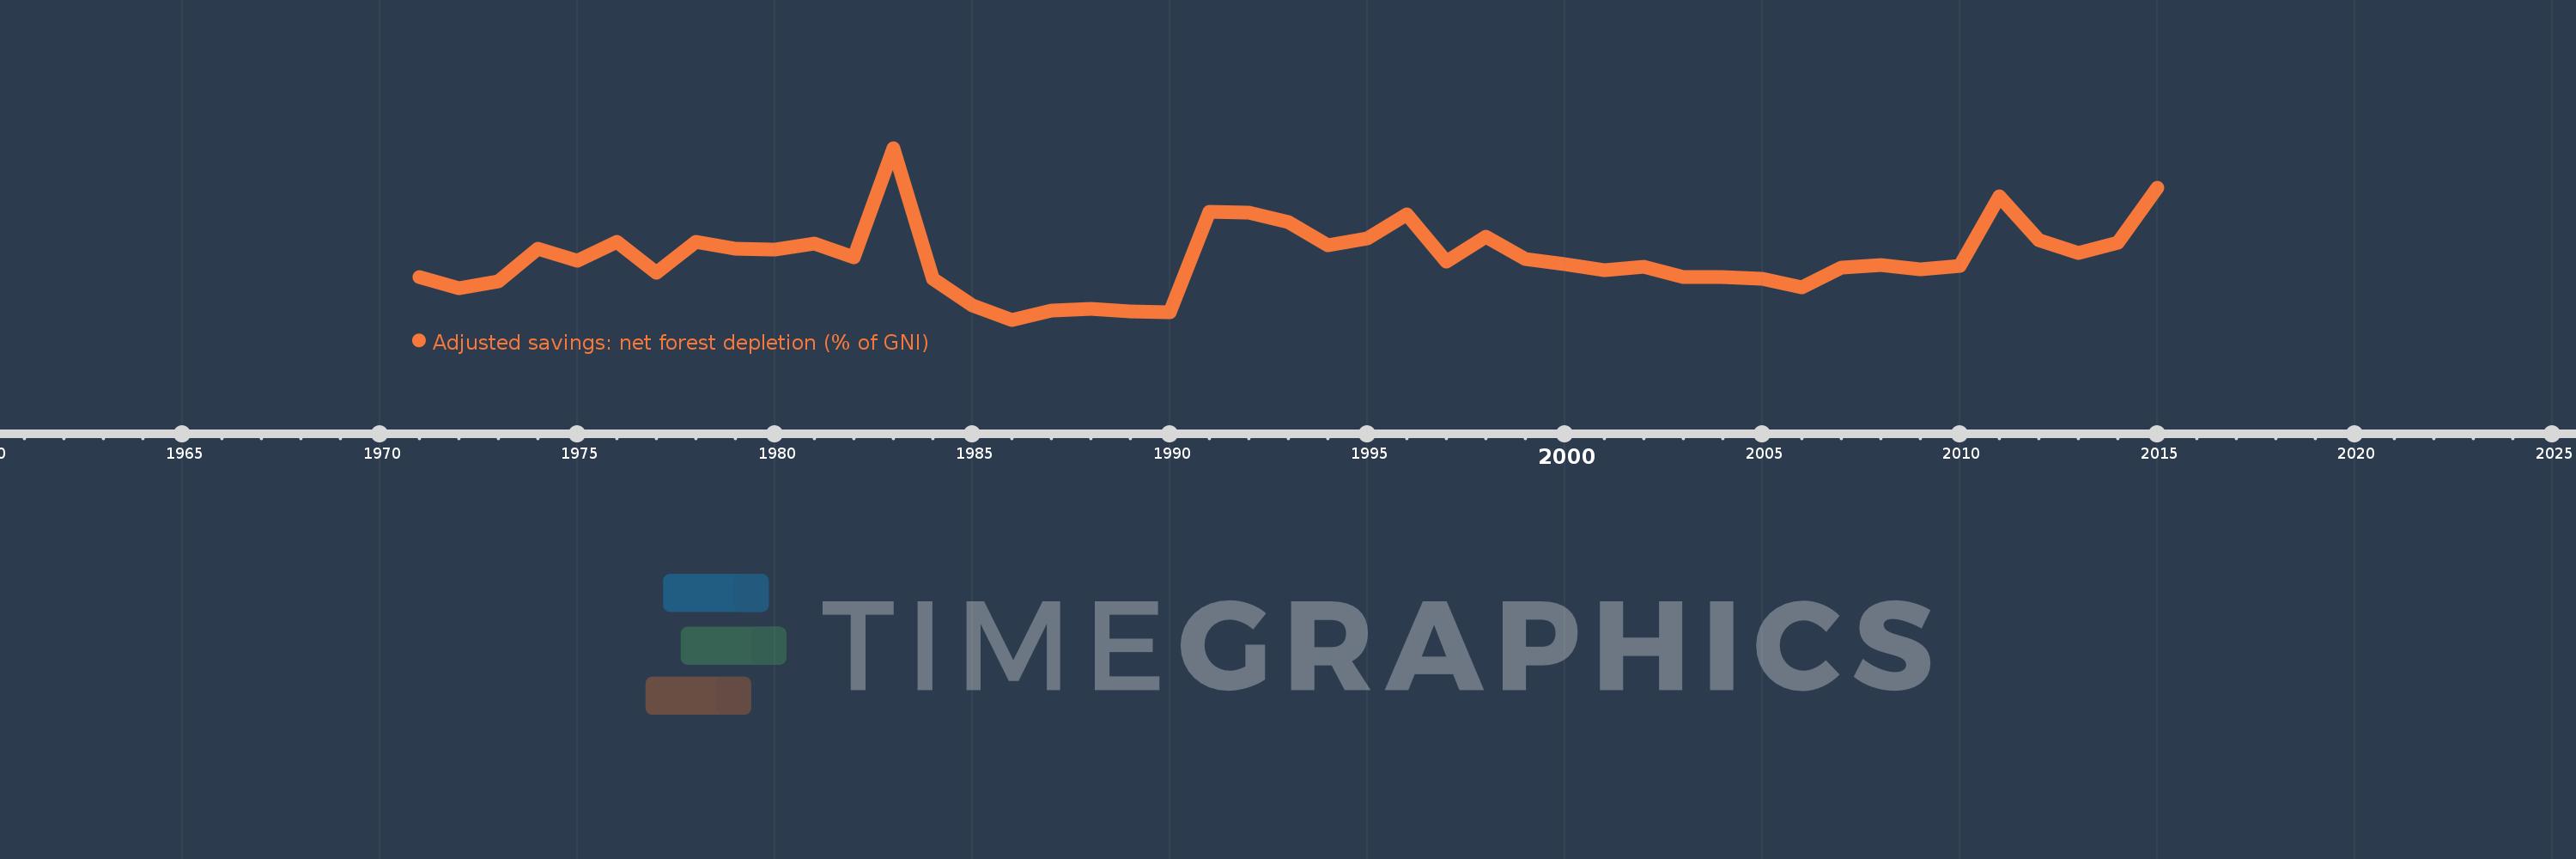
Adjusted savings: net forest depletion (% of GNI)
2015,2014,2013,2012,2011,2010,2009,2008,2007,2006,2005,2004,2003,2002,2001,2000,1999,1998,1997,1996,1995,1994,1993,1992,1991,1990,1989,1988,1987,1986,1985,1984,1983,1982,1981,1980,1979,1978,1977,1976,1975,1974,1973,1972,1971
Queste statistiche in altri paesi:
AfghanistanAlbaniaAlgeriaAngolaArab WorldArgentinaArmeniaAustraliaAustriaAzerbaijanBahamas, TheBahrainBangladeshBarbadosBelarusBelgiumBelizeBeninBhutanBoliviaBotswanaBrazilBrunei DarussalamBulgariaBurkina FasoBurundiCabo VerdeCambodiaCameroonCanadaCaribbean small statesCentral African RepublicCentral Europe and the BalticsChadChileChinaColombiaComorosCongo, Dem. Rep.Congo, Rep.Costa RicaCote d'IvoireCroatiaCubaCyprusCzech RepublicDenmarkDjiboutiDominicaDominican RepublicEarly-demographic dividendEast Asia & PacificEast Asia & Pacific (excluding high income)East Asia & Pacific (IDA & IBRD countries)EcuadorEgypt, Arab Rep.El SalvadorEquatorial GuineaEritreaEstoniaEthiopiaEuro areaEurope & Central AsiaEurope & Central Asia (excluding high income)Europe & Central Asia (IDA & IBRD countries)European UnionFijiFinlandFragile and conflict affected situationsFranceFrench PolynesiaGabonGambia, TheGeorgiaGermanyGhanaGreeceGuatemalaGuineaGuinea-BissauGuyanaHaitiHeavily indebted poor countries (HIPC)High incomeHondurasHong Kong SAR, ChinaHungaryIBRD onlyIcelandIDA & IBRD totalIDA blendIDA onlyIDA totalIndiaIndonesiaIran, Islamic Rep.IraqIrelandIsraelItalyJamaicaJapanJordanKazakhstanKenyaKiribatiKorea, Rep.KuwaitKyrgyz RepublicLao PDRLate-demographic dividendLatin America & Caribbean Latin America & Caribbean (excluding high income)Latin America & the Caribbean (IDA & IBRD countries)LatviaLeast developed countries: UN classificationLebanonLesothoLiberiaLibyaLithuaniaLow & middle incomeLow incomeLower middle incomeLuxembourgMacedonia, FYRMadagascarMalawiMalaysiaMaldivesMaliMauritaniaMauritiusMexicoMicronesia, Fed. Sts.Middle East & North AfricaMiddle East & North Africa (excluding high income)Middle East & North Africa (IDA & IBRD countries)Middle incomeMoldovaMongoliaMoroccoMozambiqueMyanmarNamibiaNepalNetherlandsNew CaledoniaNew ZealandNicaraguaNigerNigeriaNorth AmericaNorwayOECD membersOmanOther small statesPacific island small statesPakistanPanamaPapua New GuineaParaguayPeruPhilippinesPolandPortugalPost-demographic dividendPre-demographic dividendQatarRomaniaRussian FederationRwandaSamoaSao Tome and PrincipeSaudi ArabiaSenegalSeychellesSierra LeoneSingaporeSlovak RepublicSloveniaSmall statesSolomon IslandsSomaliaSouth AfricaSouth AsiaSouth Asia (IDA & IBRD)SpainSri LankaSt. LuciaSt. Vincent and the GrenadinesSub-Saharan Africa Sub-Saharan Africa (excluding high income)Sub-Saharan Africa (IDA & IBRD countries)SudanSurinameSwazilandSwedenSwitzerlandSyrian Arab RepublicTajikistanTanzaniaThailandTogoTongaTrinidad and TobagoTunisiaTurkeyTurkmenistanUgandaUkraineUnited Arab EmiratesUnited KingdomUnited StatesUpper middle incomeUruguayUzbekistanVanuatuVenezuela, RBVietnamWorldYemen, Rep.ZambiaZimbabwe Linea del tempo:
Questa scala temporale mostra un grafico dal 1971 anno al 2015 anno. Guatemala. I dati fino ad 1970 anno non disponibili. Il numero di osservazioni attuali secondo i date: 45.
La fonte (nome):
Indicatori dello sviluppo mondiale
La fonte (organizzazione):
World Bank staff estimates based on sources and methods in World Bank's "The Changing Wealth of Nations: Measuring Sustainable Development in the New Millennium" (2011).
Categorie:
Economy & Growth, Environment
sono stati aggiornati
23 apr 2017 anni
Indicatori delle variazioni dei valori per anni
Minima:
0.644
1 gen 1986 anni
Massimo:
5.196
1 gen 1983 anni
Alla data di osservazione
Valore
Variazione assoluta
La variazione rispetto al valore precedente
1 gen 1971 anni
1.77
+1.77
0.0%
1 gen 1972 anni
1.488
-0.281
-15.9%
1 gen 1973 anni
1.672
+0.184
12.34%
1 gen 1974 anni
2.516
+0.844
50.5%
1 gen 1975 anni
2.2
-0.317
-12.58%
1 gen 1976 anni
2.699
+0.499
22.71%
1 gen 1977 anni
1.889
-0.81
-30.02%
1 gen 1978 anni
2.713
+0.824
43.64%
1 gen 1979 anni
2.537
-0.176
-6.5%
1 gen 1980 anni
2.508
-0.029
-1.14%
1 gen 1981 anni
2.668
+0.16
6.37%
1 gen 1982 anni
2.306
-0.361
-13.55%
1 gen 1983 anni
5.196
+2.89
125.3%
1 gen 1984 anni
1.727
-3.469
-66.76%
1 gen 1985 anni
1.026
-0.702
-40.63%
1 gen 1986 anni
0.644
-0.382
-37.24%
1 gen 1987 anni
0.898
+0.255
39.61%
1 gen 1988 anni
0.939
+0.04
4.46%
1 gen 1989 anni
0.869
-0.069
-7.4%
1 gen 1990 anni
0.832
-0.037
-4.23%
1 gen 1991 anni
3.494
+2.662
319.84%
1 gen 1992 anni
3.48
-0.015
-0.42%
1 gen 1993 anni
3.226
-0.253
-7.28%
1 gen 1994 anni
2.62
-0.606
-18.78%
1 gen 1995 anni
2.789
+0.169
6.46%
1 gen 1996 anni
3.427
+0.637
22.84%
1 gen 1997 anni
2.188
-1.238
-36.14%
1 gen 1998 anni
2.842
+0.654
29.88%
1 gen 1999 anni
2.247
-0.595
-20.93%
1 gen 2000 anni
2.125
-0.122
-5.43%
1 gen 2001 anni
1.95
-0.175
-8.23%
1 gen 2002 anni
2.045
+0.094
4.83%
1 gen 2003 anni
1.77
-0.274
-13.42%
1 gen 2004 anni
1.772
+0.002
0.12%
1 gen 2005 anni
1.741
-0.031
-1.76%
1 gen 2006 anni
1.509
-0.232
-13.34%
1 gen 2007 anni
2.02
+0.511
33.84%
1 gen 2008 anni
2.091
+0.071
3.54%
1 gen 2009 anni
1.986
-0.105
-5.01%
1 gen 2010 anni
2.08
+0.093
4.7%
1 gen 2011 anni
3.914
+1.834
88.19%
1 gen 2012 anni
2.753
-1.161
-29.66%
1 gen 2013 anni
2.42
-0.333
-12.11%
1 gen 2014 anni
2.691
+0.271
11.22%
1 gen 2015 anni
4.137
+1.446
53.72%
Classificazione dei paesi secondo i statistiche attuali per anni


Commenti: