29
/it/
it
AIzaSyAYiBZKx7MnpbEhh9jyipgxe19OcubqV5w
April 1, 2024
271831
Uganda
UGA
true
2
1
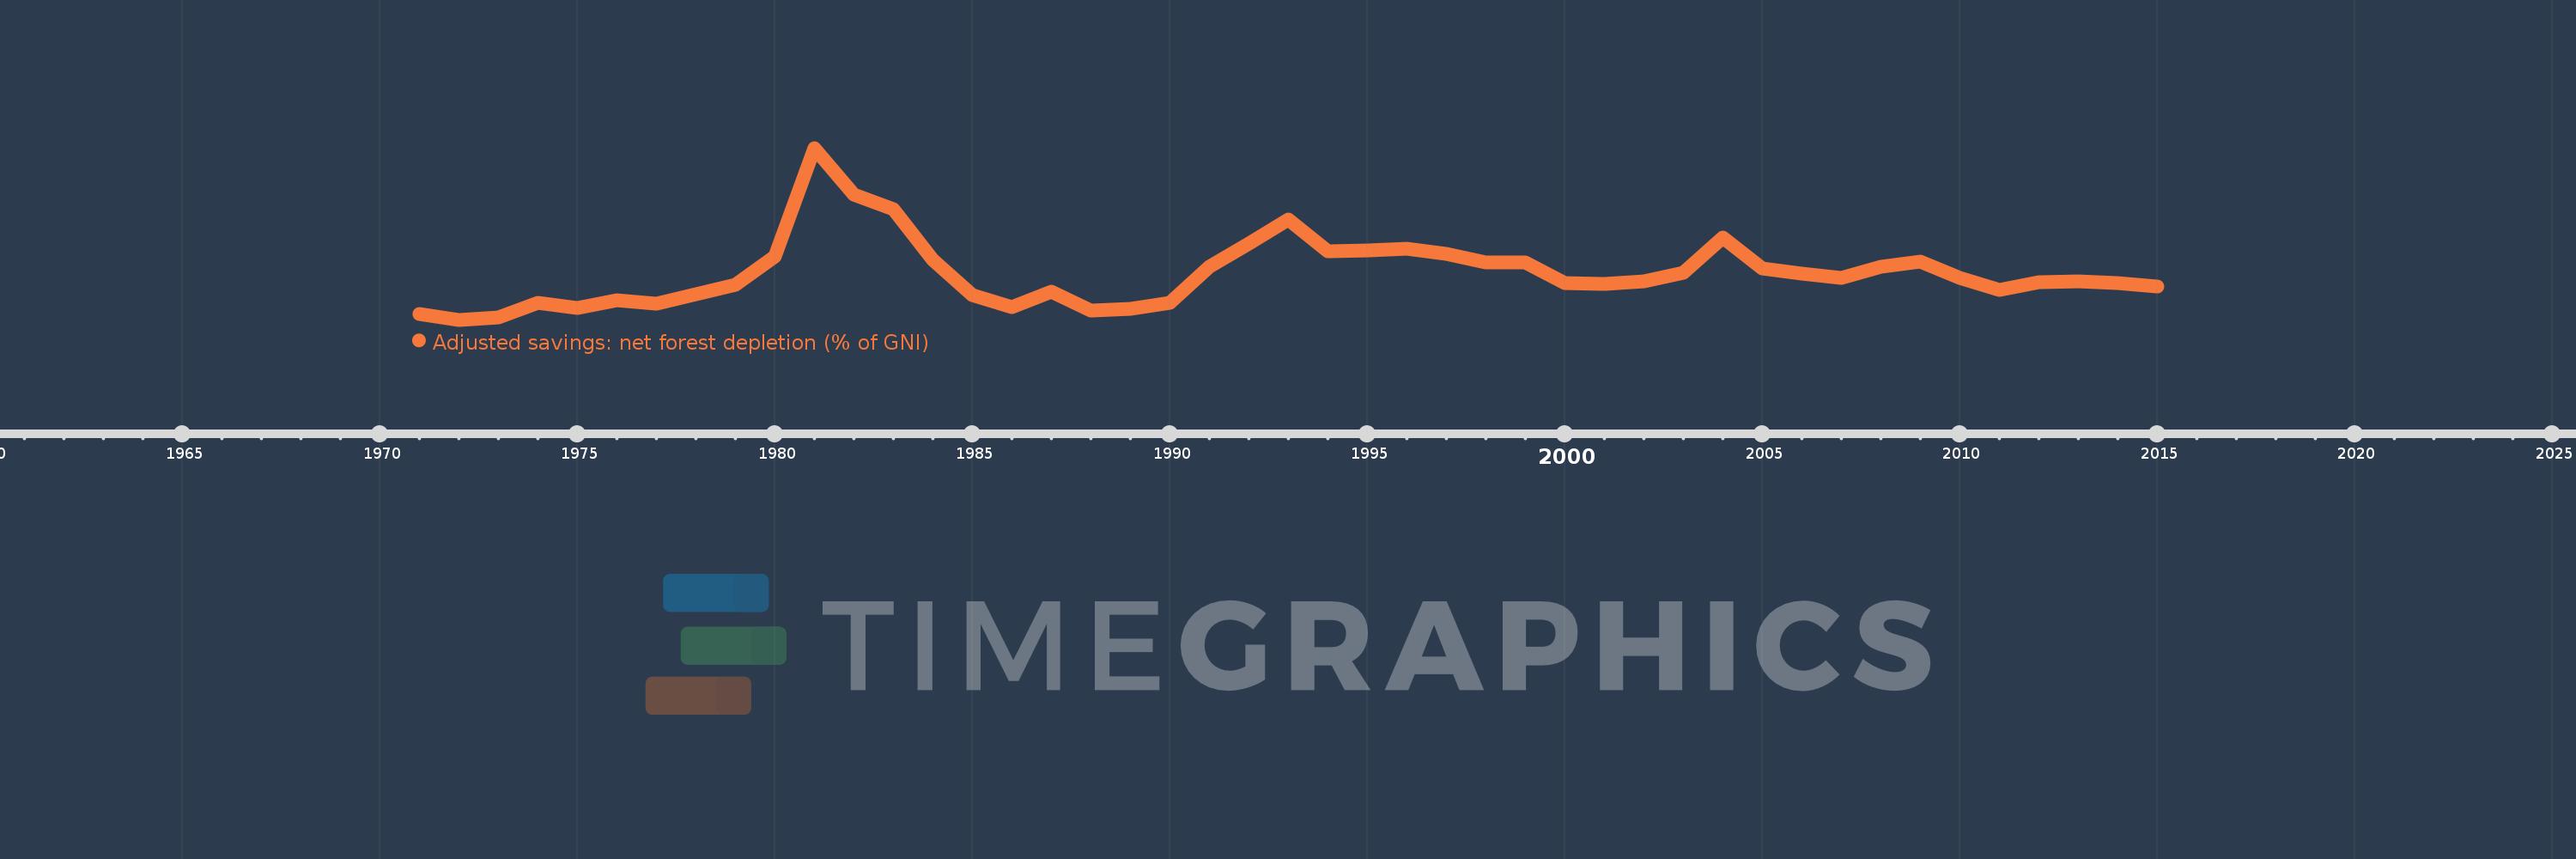
Adjusted savings: net forest depletion (% of GNI)
2015,2014,2013,2012,2011,2010,2009,2008,2007,2006,2005,2004,2003,2002,2001,2000,1999,1998,1997,1996,1995,1994,1993,1992,1991,1990,1989,1988,1987,1986,1985,1984,1983,1982,1981,1980,1979,1978,1977,1976,1975,1974,1973,1972,1971
Queste statistiche in altri paesi:
AfghanistanAlbaniaAlgeriaAngolaArab WorldArgentinaArmeniaAustraliaAustriaAzerbaijanBahamas, TheBahrainBangladeshBarbadosBelarusBelgiumBelizeBeninBhutanBoliviaBotswanaBrazilBrunei DarussalamBulgariaBurkina FasoBurundiCabo VerdeCambodiaCameroonCanadaCaribbean small statesCentral African RepublicCentral Europe and the BalticsChadChileChinaColombiaComorosCongo, Dem. Rep.Congo, Rep.Costa RicaCote d'IvoireCroatiaCubaCyprusCzech RepublicDenmarkDjiboutiDominicaDominican RepublicEarly-demographic dividendEast Asia & PacificEast Asia & Pacific (excluding high income)East Asia & Pacific (IDA & IBRD countries)EcuadorEgypt, Arab Rep.El SalvadorEquatorial GuineaEritreaEstoniaEthiopiaEuro areaEurope & Central AsiaEurope & Central Asia (excluding high income)Europe & Central Asia (IDA & IBRD countries)European UnionFijiFinlandFragile and conflict affected situationsFranceFrench PolynesiaGabonGambia, TheGeorgiaGermanyGhanaGreeceGuatemalaGuineaGuinea-BissauGuyanaHaitiHeavily indebted poor countries (HIPC)High incomeHondurasHong Kong SAR, ChinaHungaryIBRD onlyIcelandIDA & IBRD totalIDA blendIDA onlyIDA totalIndiaIndonesiaIran, Islamic Rep.IraqIrelandIsraelItalyJamaicaJapanJordanKazakhstanKenyaKiribatiKorea, Rep.KuwaitKyrgyz RepublicLao PDRLate-demographic dividendLatin America & Caribbean Latin America & Caribbean (excluding high income)Latin America & the Caribbean (IDA & IBRD countries)LatviaLeast developed countries: UN classificationLebanonLesothoLiberiaLibyaLithuaniaLow & middle incomeLow incomeLower middle incomeLuxembourgMacedonia, FYRMadagascarMalawiMalaysiaMaldivesMaliMauritaniaMauritiusMexicoMicronesia, Fed. Sts.Middle East & North AfricaMiddle East & North Africa (excluding high income)Middle East & North Africa (IDA & IBRD countries)Middle incomeMoldovaMongoliaMoroccoMozambiqueMyanmarNamibiaNepalNetherlandsNew CaledoniaNew ZealandNicaraguaNigerNigeriaNorth AmericaNorwayOECD membersOmanOther small statesPacific island small statesPakistanPanamaPapua New GuineaParaguayPeruPhilippinesPolandPortugalPost-demographic dividendPre-demographic dividendQatarRomaniaRussian FederationRwandaSamoaSao Tome and PrincipeSaudi ArabiaSenegalSeychellesSierra LeoneSingaporeSlovak RepublicSloveniaSmall statesSolomon IslandsSomaliaSouth AfricaSouth AsiaSouth Asia (IDA & IBRD)SpainSri LankaSt. LuciaSt. Vincent and the GrenadinesSub-Saharan Africa Sub-Saharan Africa (excluding high income)Sub-Saharan Africa (IDA & IBRD countries)SudanSurinameSwazilandSwedenSwitzerlandSyrian Arab RepublicTajikistanTanzaniaThailandTogoTongaTrinidad and TobagoTunisiaTurkeyTurkmenistanUgandaUkraineUnited Arab EmiratesUnited KingdomUnited StatesUpper middle incomeUruguayUzbekistanVanuatuVenezuela, RBVietnamWorldYemen, Rep.ZambiaZimbabwe Linea del tempo:
Questa scala temporale mostra un grafico dal 1971 anno al 2015 anno. Uganda. I dati fino ad 1970 anno non disponibili. Il numero di osservazioni attuali secondo i date: 45.
La fonte (nome):
Indicatori dello sviluppo mondiale
La fonte (organizzazione):
World Bank staff estimates based on sources and methods in World Bank's "The Changing Wealth of Nations: Measuring Sustainable Development in the New Millennium" (2011).
Categorie:
Economy & Growth, Environment
sono stati aggiornati
23 apr 2017 anni
Indicatori delle variazioni dei valori per anni
Minima:
4.488
1 gen 1972 anni
Massimo:
40.99
1 gen 1981 anni
Alla data di osservazione
Valore
Variazione assoluta
La variazione rispetto al valore precedente
1 gen 1971 anni
5.774
+5.774
0.0%
1 gen 1972 anni
4.488
-1.286
-22.27%
1 gen 1973 anni
5.021
+0.532
11.85%
1 gen 1974 anni
8.073
+3.052
60.79%
1 gen 1975 anni
7.032
-1.041
-12.89%
1 gen 1976 anni
8.662
+1.63
23.18%
1 gen 1977 anni
7.948
-0.714
-8.24%
1 gen 1978 anni
9.929
+1.981
24.92%
1 gen 1979 anni
11.892
+1.964
19.78%
1 gen 1980 anni
17.968
+6.076
51.09%
1 gen 1981 anni
40.99
+23.022
128.13%
1 gen 1982 anni
31.11
-9.881
-24.11%
1 gen 1983 anni
27.941
-3.169
-10.19%
1 gen 1984 anni
17.253
-10.687
-38.25%
1 gen 1985 anni
9.763
-7.49
-43.41%
1 gen 1986 anni
7.203
-2.56
-26.22%
1 gen 1987 anni
10.542
+3.339
46.35%
1 gen 1988 anni
6.364
-4.179
-39.64%
1 gen 1989 anni
6.838
+0.474
7.45%
1 gen 1990 anni
8.08
+1.242
18.16%
1 gen 1991 anni
15.682
+7.603
94.1%
1 gen 1992 anni
20.732
+5.05
32.2%
1 gen 1993 anni
25.705
+4.973
23.98%
1 gen 1994 anni
18.964
-6.741
-26.23%
1 gen 1995 anni
19.172
+0.208
1.1%
1 gen 1996 anni
19.551
+0.379
1.98%
1 gen 1997 anni
18.558
-0.993
-5.08%
1 gen 1998 anni
16.696
-1.862
-10.03%
1 gen 1999 anni
16.621
-0.075
-0.45%
1 gen 2000 anni
12.353
-4.268
-25.68%
1 gen 2001 anni
12.131
-0.221
-1.79%
1 gen 2002 anni
12.68
+0.548
4.52%
1 gen 2003 anni
14.417
+1.737
13.7%
1 gen 2004 anni
22.045
+7.628
52.91%
1 gen 2005 anni
15.409
-6.637
-30.1%
1 gen 2006 anni
14.331
-1.077
-6.99%
1 gen 2007 anni
13.414
-0.917
-6.4%
1 gen 2008 anni
15.689
+2.275
16.96%
1 gen 2009 anni
16.76
+1.071
6.83%
1 gen 2010 anni
13.35
-3.41
-20.34%
1 gen 2011 anni
10.736
-2.614
-19.58%
1 gen 2012 anni
12.528
+1.791
16.68%
1 gen 2013 anni
12.669
+0.141
1.13%
1 gen 2014 anni
12.244
-0.425
-3.35%
1 gen 2015 anni
11.501
-0.743
-6.07%
Classificazione dei paesi secondo i statistiche attuali per anni


Commenti: