29
/it/
it
AIzaSyAYiBZKx7MnpbEhh9jyipgxe19OcubqV5w
April 1, 2024
95133
Burkina Faso
BFA
true
2
1
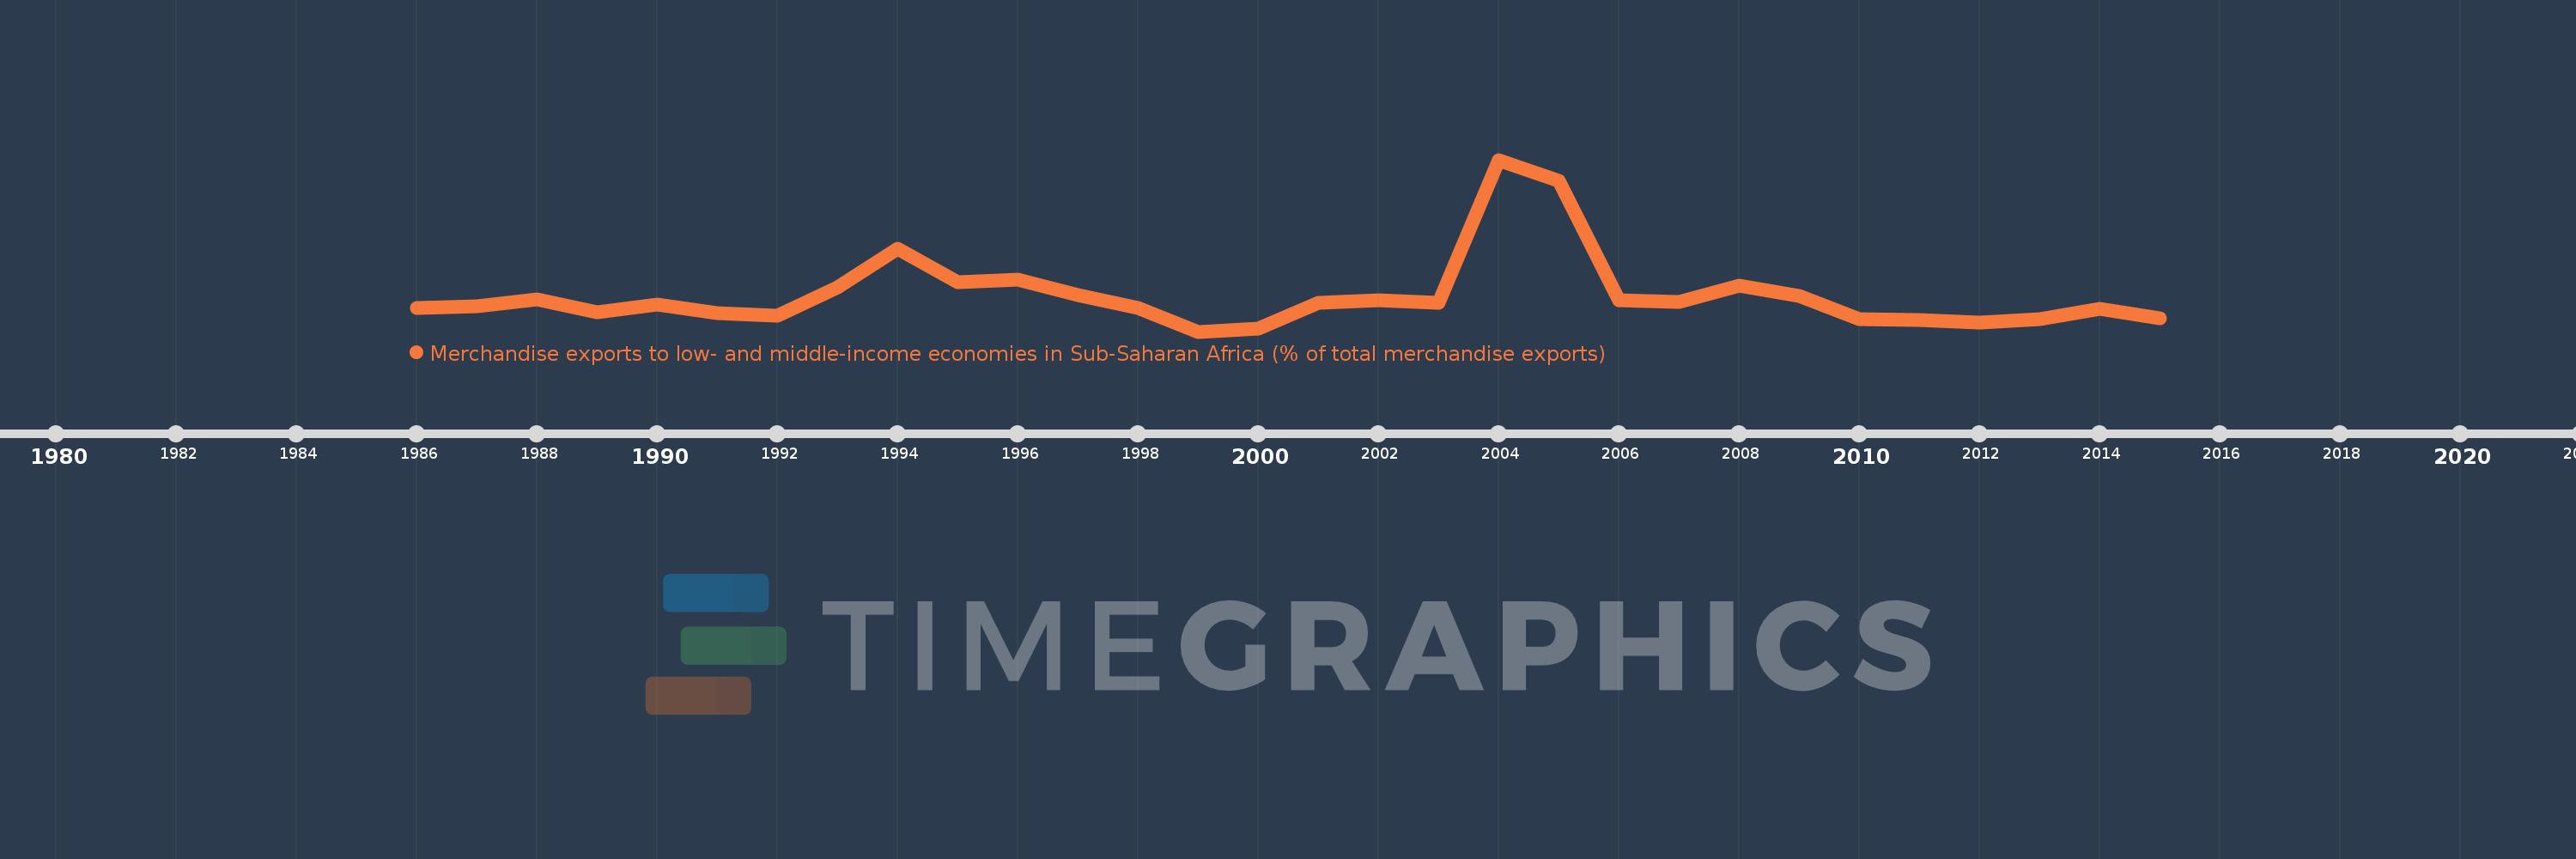
Merchandise exports to low- and middle-income economies in Sub-Saharan Africa (% of total merchandise exports)
2015,2014,2013,2012,2011,2010,2009,2008,2007,2006,2005,2004,2003,2002,2001,2000,1999,1998,1997,1996,1995,1994,1993,1992,1991,1990,1989,1988,1987,1986
Queste statistiche in altri paesi:
AfghanistanAlbaniaAlgeriaAngolaArab WorldArgentinaArmeniaAustraliaAustriaAzerbaijanBahamas, TheBahrainBangladeshBarbadosBelarusBelgiumBelizeBeninBermudaBoliviaBrazilBulgariaBurkina FasoBurundiCabo VerdeCambodiaCameroonCanadaCaribbean small statesCentral African RepublicCentral Europe and the BalticsChadChileChinaColombiaCongo, Dem. Rep.Congo, Rep.Costa RicaCote d'IvoireCroatiaCubaCyprusCzech RepublicDenmarkDjiboutiDominicaDominican RepublicEarly-demographic dividendEast Asia & PacificEast Asia & Pacific (excluding high income)East Asia & Pacific (IDA & IBRD countries)EcuadorEgypt, Arab Rep.EstoniaEthiopiaEuro areaEurope & Central AsiaEurope & Central Asia (excluding high income)Europe & Central Asia (IDA & IBRD countries)European UnionFijiFinlandFragile and conflict affected situationsFranceGabonGambia, TheGeorgiaGermanyGhanaGibraltarGreeceGreenlandGuatemalaGuineaGuinea-BissauGuyanaHaitiHeavily indebted poor countries (HIPC)High incomeHondurasHong Kong SAR, ChinaHungaryIBRD onlyIcelandIDA & IBRD totalIDA blendIDA onlyIDA totalIndiaIndonesiaIran, Islamic Rep.IraqIrelandIsraelItalyJamaicaJapanJordanKazakhstanKenyaKorea, Dem. People’s Rep.Korea, Rep.KuwaitLao PDRLate-demographic dividendLatin America & Caribbean Latin America & Caribbean (excluding high income)Latin America & the Caribbean (IDA & IBRD countries)LatviaLeast developed countries: UN classificationLebanonLiberiaLibyaLithuaniaLow & middle incomeLow incomeLower middle incomeLuxembourgMacao SAR, ChinaMacedonia, FYRMadagascarMalawiMalaysiaMaliMaltaMauritaniaMauritiusMexicoMiddle East & North AfricaMiddle East & North Africa (excluding high income)Middle East & North Africa (IDA & IBRD countries)Middle incomeMoldovaMontenegroMoroccoMozambiqueMyanmarNetherlandsNew ZealandNicaraguaNigerNigeriaNorth AmericaNorwayOECD membersOmanOther small statesPacific island small statesPakistanPanamaPapua New GuineaParaguayPeruPhilippinesPolandPortugalPost-demographic dividendPre-demographic dividendQatarRomaniaRussian FederationRwandaSaudi ArabiaSenegalSerbiaSeychellesSierra LeoneSingaporeSlovak RepublicSloveniaSmall statesSomaliaSouth AfricaSouth AsiaSouth Asia (IDA & IBRD)SpainSri LankaSt. LuciaSt. Vincent and the GrenadinesSub-Saharan Africa Sub-Saharan Africa (excluding high income)Sub-Saharan Africa (IDA & IBRD countries)SudanSurinameSwedenSwitzerlandSyrian Arab RepublicTanzaniaThailandTogoTrinidad and TobagoTunisiaTurkeyUgandaUkraineUnited Arab EmiratesUnited KingdomUnited StatesUpper middle incomeUruguayVenezuela, RBVietnamWorldYemen, Rep.ZambiaZimbabwe Linea del tempo:
Questa scala temporale mostra un grafico dal 1986 anno al 2015 anno. Burkina Faso. I dati fino ad 1985 anno non disponibili. Il numero di osservazioni attuali secondo i date: 30.
La fonte (nome):
Indicatori dello sviluppo mondiale
La fonte (organizzazione):
World Bank staff estimates based data from International Monetary Fund's Direction of Trade database.
Categorie:
Private Sector, Trade
sono stati aggiornati
23 apr 2017 anni
Indicatori delle variazioni dei valori per anni
Minima:
8.668
1 gen 1999 anni
Massimo:
89.34
1 gen 2004 anni
Alla data di osservazione
Valore
Variazione assoluta
La variazione rispetto al valore precedente
1 gen 1986 anni
19.854
+19.854
0.0%
1 gen 1987 anni
20.691
+0.836
4.21%
1 gen 1988 anni
23.596
+2.905
14.04%
1 gen 1989 anni
17.687
-5.909
-25.04%
1 gen 1990 anni
21.253
+3.566
20.16%
1 gen 1991 anni
17.262
-3.991
-18.78%
1 gen 1992 anni
16.151
-1.111
-6.43%
1 gen 1993 anni
29.476
+13.325
82.5%
1 gen 1994 anni
47.576
+18.1
61.4%
1 gen 1995 anni
31.66
-15.917
-33.45%
1 gen 1996 anni
33.055
+1.395
4.41%
1 gen 1997 anni
25.629
-7.426
-22.47%
1 gen 1998 anni
19.604
-6.025
-23.51%
1 gen 1999 anni
8.668
-10.936
-55.78%
1 gen 2000 anni
10.169
+1.501
17.32%
1 gen 2001 anni
21.995
+11.826
116.29%
1 gen 2002 anni
23.217
+1.222
5.56%
1 gen 2003 anni
22.165
-1.051
-4.53%
1 gen 2004 anni
89.34
+67.174
303.06%
1 gen 2005 anni
79.406
-9.934
-11.12%
1 gen 2006 anni
23.485
-55.921
-70.42%
1 gen 2007 anni
22.773
-0.711
-3.03%
1 gen 2008 anni
30.203
+7.43
32.63%
1 gen 2009 anni
25.415
-4.788
-15.85%
1 gen 2010 anni
14.673
-10.741
-42.26%
1 gen 2011 anni
14.121
-0.553
-3.77%
1 gen 2012 anni
12.703
-1.418
-10.04%
1 gen 2013 anni
14.629
+1.926
15.16%
1 gen 2014 anni
19.342
+4.713
32.21%
1 gen 2015 anni
14.755
-4.587
-23.72%
Classificazione dei paesi secondo i statistiche attuali per anni


Commenti: