29
/it/
it
AIzaSyAYiBZKx7MnpbEhh9jyipgxe19OcubqV5w
April 1, 2024
183132
Macao SAR, China
MAC
true
2
1
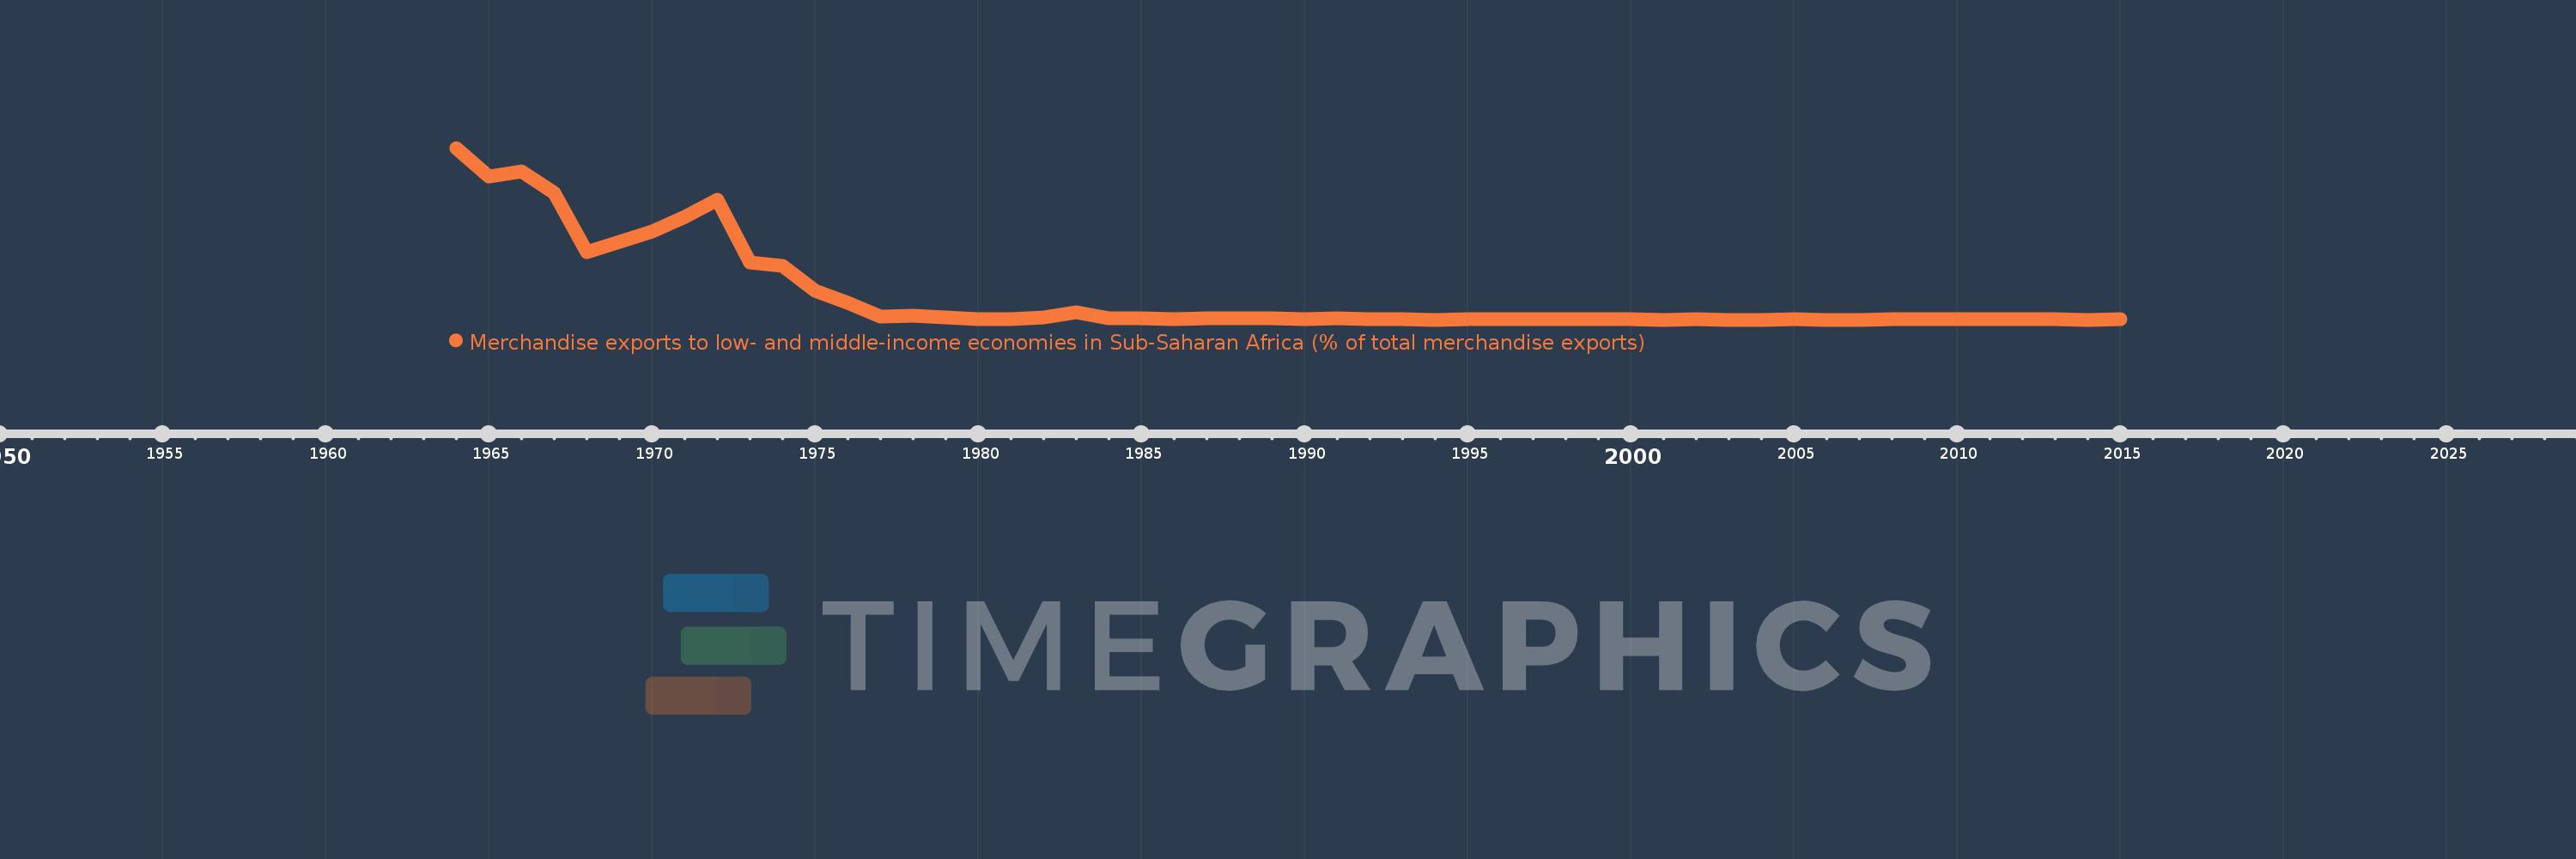
Merchandise exports to low- and middle-income economies in Sub-Saharan Africa (% of total merchandise exports)
2015,2014,2013,2012,2011,2010,2009,2008,2007,2006,2005,2004,2003,2002,2001,2000,1999,1998,1997,1996,1995,1994,1993,1992,1991,1990,1989,1988,1987,1986,1985,1984,1983,1982,1981,1980,1979,1978,1977,1976,1975,1974,1973,1972,1971,1970,1968,1967,1966,1965,1964
Queste statistiche in altri paesi:
AfghanistanAlbaniaAlgeriaAngolaArab WorldArgentinaArmeniaAustraliaAustriaAzerbaijanBahamas, TheBahrainBangladeshBarbadosBelarusBelgiumBelizeBeninBermudaBoliviaBrazilBulgariaBurkina FasoBurundiCabo VerdeCambodiaCameroonCanadaCaribbean small statesCentral African RepublicCentral Europe and the BalticsChadChileChinaColombiaCongo, Dem. Rep.Congo, Rep.Costa RicaCote d'IvoireCroatiaCubaCyprusCzech RepublicDenmarkDjiboutiDominicaDominican RepublicEarly-demographic dividendEast Asia & PacificEast Asia & Pacific (excluding high income)East Asia & Pacific (IDA & IBRD countries)EcuadorEgypt, Arab Rep.EstoniaEthiopiaEuro areaEurope & Central AsiaEurope & Central Asia (excluding high income)Europe & Central Asia (IDA & IBRD countries)European UnionFijiFinlandFragile and conflict affected situationsFranceGabonGambia, TheGeorgiaGermanyGhanaGibraltarGreeceGreenlandGuatemalaGuineaGuinea-BissauGuyanaHaitiHeavily indebted poor countries (HIPC)High incomeHondurasHong Kong SAR, ChinaHungaryIBRD onlyIcelandIDA & IBRD totalIDA blendIDA onlyIDA totalIndiaIndonesiaIran, Islamic Rep.IraqIrelandIsraelItalyJamaicaJapanJordanKazakhstanKenyaKorea, Dem. People’s Rep.Korea, Rep.KuwaitLao PDRLate-demographic dividendLatin America & Caribbean Latin America & Caribbean (excluding high income)Latin America & the Caribbean (IDA & IBRD countries)LatviaLeast developed countries: UN classificationLebanonLiberiaLibyaLithuaniaLow & middle incomeLow incomeLower middle incomeLuxembourgMacao SAR, ChinaMacedonia, FYRMadagascarMalawiMalaysiaMaliMaltaMauritaniaMauritiusMexicoMiddle East & North AfricaMiddle East & North Africa (excluding high income)Middle East & North Africa (IDA & IBRD countries)Middle incomeMoldovaMontenegroMoroccoMozambiqueMyanmarNetherlandsNew ZealandNicaraguaNigerNigeriaNorth AmericaNorwayOECD membersOmanOther small statesPacific island small statesPakistanPanamaPapua New GuineaParaguayPeruPhilippinesPolandPortugalPost-demographic dividendPre-demographic dividendQatarRomaniaRussian FederationRwandaSaudi ArabiaSenegalSerbiaSeychellesSierra LeoneSingaporeSlovak RepublicSloveniaSmall statesSomaliaSouth AfricaSouth AsiaSouth Asia (IDA & IBRD)SpainSri LankaSt. LuciaSt. Vincent and the GrenadinesSub-Saharan Africa Sub-Saharan Africa (excluding high income)Sub-Saharan Africa (IDA & IBRD countries)SudanSurinameSwedenSwitzerlandSyrian Arab RepublicTanzaniaThailandTogoTrinidad and TobagoTunisiaTurkeyUgandaUkraineUnited Arab EmiratesUnited KingdomUnited StatesUpper middle incomeUruguayVenezuela, RBVietnamWorldYemen, Rep.ZambiaZimbabwe Linea del tempo:
Questa scala temporale mostra un grafico dal 1964 anno al 2015 anno. Macao SAR, China. I dati fino ad 1963 anno non disponibili. Il numero di osservazioni attuali secondo i date: 51.
La fonte (nome):
Indicatori dello sviluppo mondiale
La fonte (organizzazione):
World Bank staff estimates based data from International Monetary Fund's Direction of Trade database.
Categorie:
Private Sector, Trade
sono stati aggiornati
23 apr 2017 anni
Indicatori delle variazioni dei valori per anni
Minima:
0.011
1 gen 2014 anni
Massimo:
29.648
1 gen 1964 anni
Alla data di osservazione
Valore
Variazione assoluta
La variazione rispetto al valore precedente
1 gen 1964 anni
29.648
+29.648
0.0%
1 gen 1965 anni
24.645
-5.004
-16.88%
1 gen 1966 anni
25.604
+0.959
3.89%
1 gen 1967 anni
21.849
-3.755
-14.67%
1 gen 1968 anni
11.6
-10.249
-46.91%
1 gen 1970 anni
15.22
+3.62
31.2%
1 gen 1971 anni
17.742
+2.522
16.57%
1 gen 1972 anni
20.774
+3.033
17.09%
1 gen 1973 anni
9.888
-10.887
-52.4%
1 gen 1974 anni
9.288
-0.6
-6.07%
1 gen 1975 anni
5.01
-4.277
-46.05%
1 gen 1976 anni
2.934
-2.076
-41.43%
1 gen 1977 anni
0.503
-2.431
-82.86%
1 gen 1978 anni
0.768
+0.265
52.77%
1 gen 1979 anni
0.367
-0.401
-52.2%
1 gen 1980 anni
0.156
-0.212
-57.64%
1 gen 1981 anni
0.133
-0.023
-14.47%
1 gen 1982 anni
0.372
+0.239
179.77%
1 gen 1983 anni
1.314
+0.942
252.95%
1 gen 1984 anni
0.196
-1.118
-85.06%
1 gen 1985 anni
0.215
+0.019
9.61%
1 gen 1986 anni
0.137
-0.078
-36.48%
1 gen 1987 anni
0.217
+0.08
58.56%
1 gen 1988 anni
0.23
+0.013
5.96%
1 gen 1989 anni
0.218
-0.012
-5.04%
1 gen 1990 anni
0.162
-0.056
-25.47%
1 gen 1991 anni
0.309
+0.147
90.25%
1 gen 1992 anni
0.1
-0.209
-67.58%
1 gen 1993 anni
0.081
-0.019
-19.37%
1 gen 1994 anni
0.033
-0.047
-58.65%
1 gen 1995 anni
0.056
+0.023
69.01%
1 gen 1996 anni
0.093
+0.036
64.11%
1 gen 1997 anni
0.065
-0.028
-30.22%
1 gen 1998 anni
0.057
-0.008
-11.72%
1 gen 1999 anni
0.158
+0.1
176.01%
1 gen 2000 anni
0.081
-0.077
-48.67%
1 gen 2001 anni
0.038
-0.043
-52.62%
1 gen 2002 anni
0.072
+0.034
89.18%
1 gen 2003 anni
0.012
-0.061
-83.92%
1 gen 2004 anni
0.012
+0.001
6.13%
1 gen 2005 anni
0.053
+0.041
328.41%
1 gen 2006 anni
0.025
-0.028
-52.86%
1 gen 2007 anni
0.022
-0.003
-10.09%
1 gen 2008 anni
0.128
+0.106
470.53%
1 gen 2009 anni
0.111
-0.018
-13.71%
1 gen 2010 anni
0.082
-0.029
-25.97%
1 gen 2011 anni
0.179
+0.097
118.69%
1 gen 2012 anni
0.145
-0.034
-19.26%
1 gen 2013 anni
0.106
-0.039
-26.87%
1 gen 2014 anni
0.011
-0.095
-89.49%
1 gen 2015 anni
0.055
+0.044
397.31%
Classificazione dei paesi secondo i statistiche attuali per anni


Commenti: