29
/it/
it
AIzaSyAYiBZKx7MnpbEhh9jyipgxe19OcubqV5w
April 1, 2024
228771
Romania
ROU
true
2
1
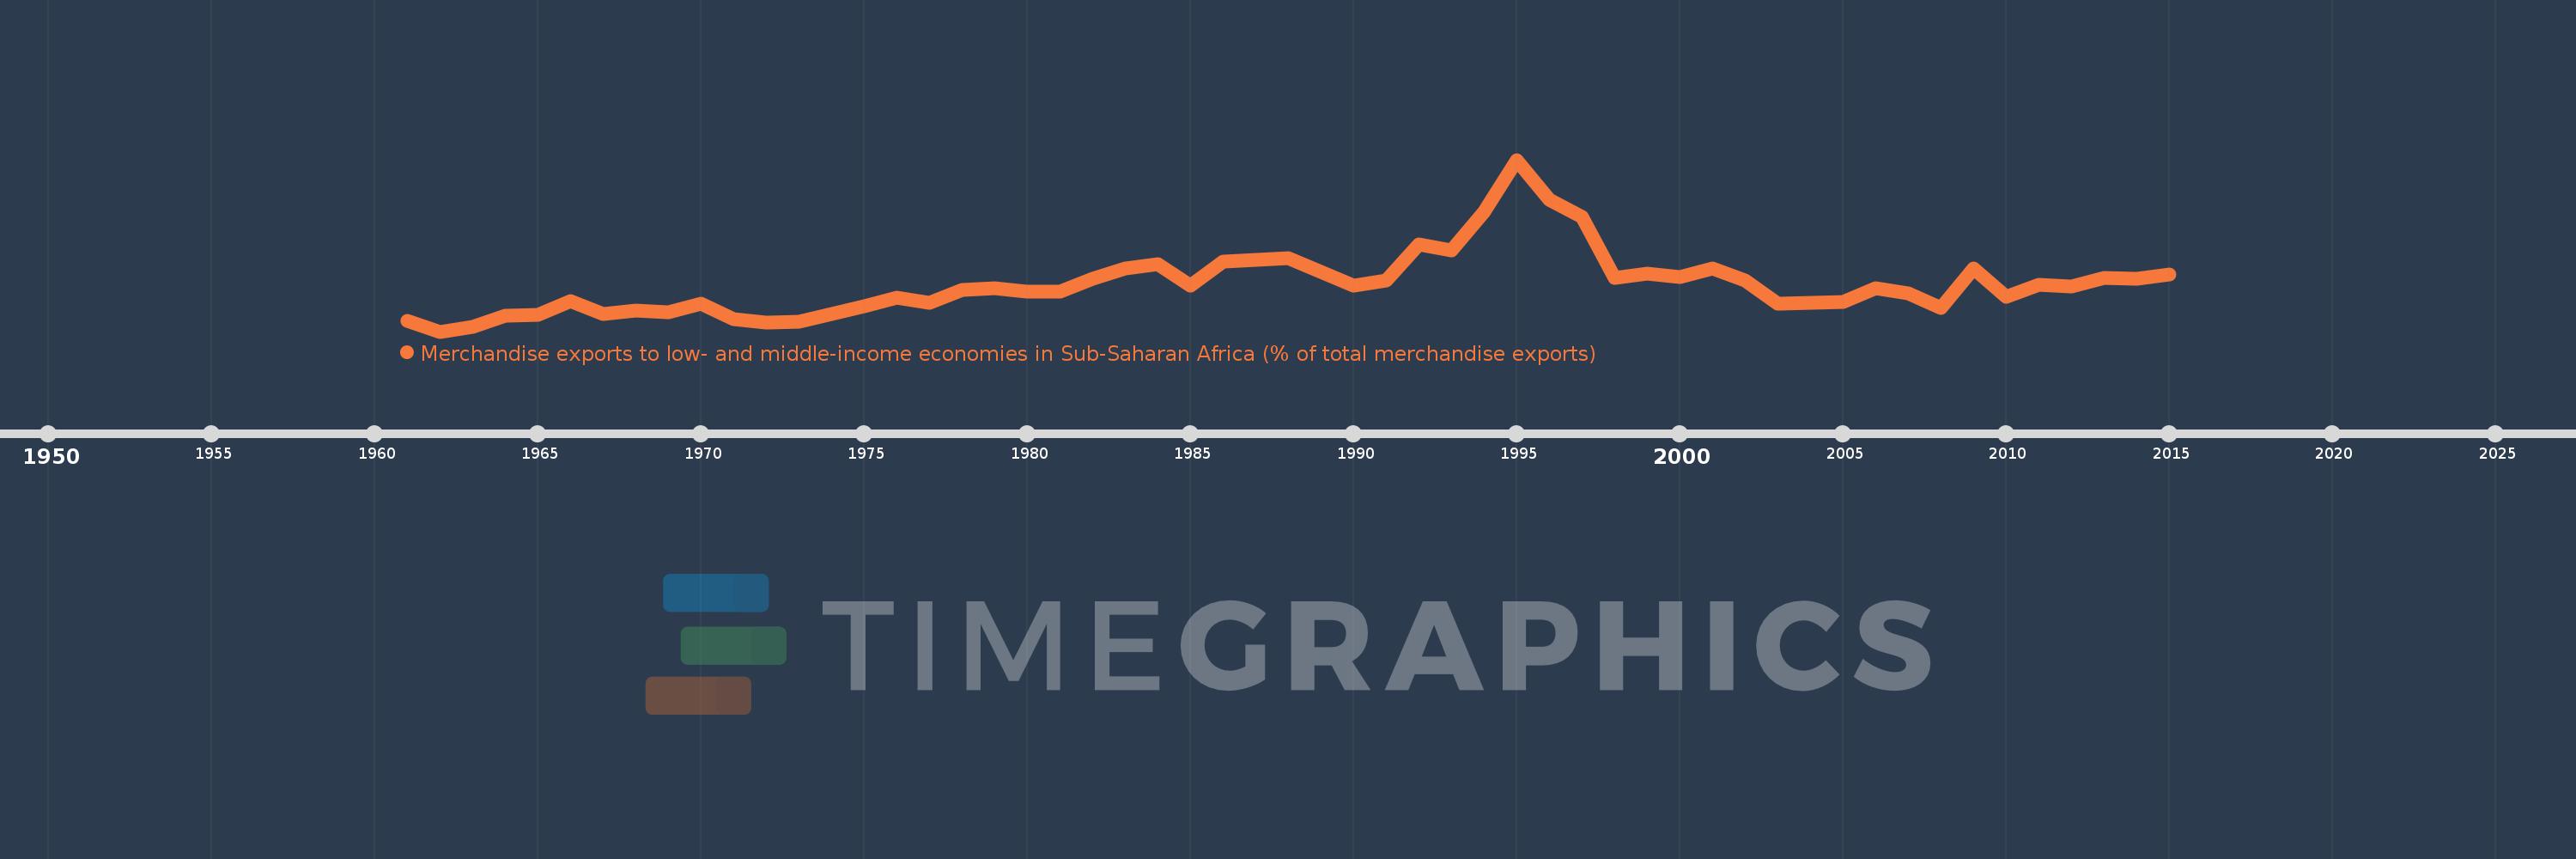
Merchandise exports to low- and middle-income economies in Sub-Saharan Africa (% of total merchandise exports)
2015,2014,2013,2012,2011,2010,2009,2008,2007,2006,2005,2004,2003,2002,2001,2000,1999,1998,1997,1996,1995,1994,1993,1992,1991,1990,1989,1988,1987,1986,1985,1984,1983,1982,1981,1980,1979,1978,1977,1976,1975,1974,1973,1972,1971,1970,1969,1968,1967,1966,1965,1964,1963,1962,1961
Queste statistiche in altri paesi:
AfghanistanAlbaniaAlgeriaAngolaArab WorldArgentinaArmeniaAustraliaAustriaAzerbaijanBahamas, TheBahrainBangladeshBarbadosBelarusBelgiumBelizeBeninBermudaBoliviaBrazilBulgariaBurkina FasoBurundiCabo VerdeCambodiaCameroonCanadaCaribbean small statesCentral African RepublicCentral Europe and the BalticsChadChileChinaColombiaCongo, Dem. Rep.Congo, Rep.Costa RicaCote d'IvoireCroatiaCubaCyprusCzech RepublicDenmarkDjiboutiDominicaDominican RepublicEarly-demographic dividendEast Asia & PacificEast Asia & Pacific (excluding high income)East Asia & Pacific (IDA & IBRD countries)EcuadorEgypt, Arab Rep.EstoniaEthiopiaEuro areaEurope & Central AsiaEurope & Central Asia (excluding high income)Europe & Central Asia (IDA & IBRD countries)European UnionFijiFinlandFragile and conflict affected situationsFranceGabonGambia, TheGeorgiaGermanyGhanaGibraltarGreeceGreenlandGuatemalaGuineaGuinea-BissauGuyanaHaitiHeavily indebted poor countries (HIPC)High incomeHondurasHong Kong SAR, ChinaHungaryIBRD onlyIcelandIDA & IBRD totalIDA blendIDA onlyIDA totalIndiaIndonesiaIran, Islamic Rep.IraqIrelandIsraelItalyJamaicaJapanJordanKazakhstanKenyaKorea, Dem. People’s Rep.Korea, Rep.KuwaitLao PDRLate-demographic dividendLatin America & Caribbean Latin America & Caribbean (excluding high income)Latin America & the Caribbean (IDA & IBRD countries)LatviaLeast developed countries: UN classificationLebanonLiberiaLibyaLithuaniaLow & middle incomeLow incomeLower middle incomeLuxembourgMacao SAR, ChinaMacedonia, FYRMadagascarMalawiMalaysiaMaliMaltaMauritaniaMauritiusMexicoMiddle East & North AfricaMiddle East & North Africa (excluding high income)Middle East & North Africa (IDA & IBRD countries)Middle incomeMoldovaMontenegroMoroccoMozambiqueMyanmarNetherlandsNew ZealandNicaraguaNigerNigeriaNorth AmericaNorwayOECD membersOmanOther small statesPacific island small statesPakistanPanamaPapua New GuineaParaguayPeruPhilippinesPolandPortugalPost-demographic dividendPre-demographic dividendQatarRomaniaRussian FederationRwandaSaudi ArabiaSenegalSerbiaSeychellesSierra LeoneSingaporeSlovak RepublicSloveniaSmall statesSomaliaSouth AfricaSouth AsiaSouth Asia (IDA & IBRD)SpainSri LankaSt. LuciaSt. Vincent and the GrenadinesSub-Saharan Africa Sub-Saharan Africa (excluding high income)Sub-Saharan Africa (IDA & IBRD countries)SudanSurinameSwedenSwitzerlandSyrian Arab RepublicTanzaniaThailandTogoTrinidad and TobagoTunisiaTurkeyUgandaUkraineUnited Arab EmiratesUnited KingdomUnited StatesUpper middle incomeUruguayVenezuela, RBVietnamWorldYemen, Rep.ZambiaZimbabwe Linea del tempo:
Questa scala temporale mostra un grafico dal 1961 anno al 2015 anno. Romania. I dati fino ad 1960 anno non disponibili. Il numero di osservazioni attuali secondo i date: 55.
La fonte (nome):
Indicatori dello sviluppo mondiale
La fonte (organizzazione):
World Bank staff estimates based data from International Monetary Fund's Direction of Trade database.
Categorie:
Private Sector, Trade
sono stati aggiornati
23 apr 2017 anni
Indicatori delle variazioni dei valori per anni
Minima:
0.042
1 gen 1962 anni
Massimo:
2.831
1 gen 1995 anni
Alla data di osservazione
Valore
Variazione assoluta
La variazione rispetto al valore precedente
1 gen 1961 anni
0.222
+0.222
0.0%
1 gen 1962 anni
0.042
-0.18
-81.12%
1 gen 1963 anni
0.125
+0.084
199.62%
1 gen 1964 anni
0.295
+0.17
135.16%
1 gen 1965 anni
0.32
+0.025
8.62%
1 gen 1966 anni
0.54
+0.219
68.51%
1 gen 1967 anni
0.324
-0.215
-39.9%
1 gen 1968 anni
0.382
+0.058
17.82%
1 gen 1969 anni
0.362
-0.02
-5.35%
1 gen 1970 anni
0.489
+0.127
35.14%
1 gen 1971 anni
0.251
-0.238
-48.69%
1 gen 1972 anni
0.189
-0.062
-24.76%
1 gen 1973 anni
0.209
+0.021
10.96%
1 gen 1974 anni
0.322
+0.113
53.81%
1 gen 1975 anni
0.448
+0.125
38.94%
1 gen 1976 anni
0.593
+0.146
32.56%
1 gen 1977 anni
0.505
-0.088
-14.85%
1 gen 1978 anni
0.725
+0.22
43.52%
1 gen 1979 anni
0.752
+0.026
3.64%
1 gen 1980 anni
0.695
-0.056
-7.5%
1 gen 1981 anni
0.697
+0.002
0.24%
1 gen 1982 anni
0.896
+0.199
28.51%
1 gen 1983 anni
1.07
+0.175
19.53%
1 gen 1984 anni
1.135
+0.065
6.08%
1 gen 1985 anni
0.783
-0.352
-31.04%
1 gen 1986 anni
1.18
+0.397
50.76%
1 gen 1987 anni
1.21
+0.029
2.49%
1 gen 1988 anni
1.229
+0.019
1.58%
1 gen 1989 anni
1.018
-0.21
-17.13%
1 gen 1990 anni
0.787
-0.231
-22.71%
1 gen 1991 anni
0.874
+0.087
11.0%
1 gen 1992 anni
1.462
+0.588
67.26%
1 gen 1993 anni
1.358
-0.104
-7.09%
1 gen 1994 anni
1.989
+0.631
46.46%
1 gen 1995 anni
2.831
+0.842
42.36%
1 gen 1996 anni
2.178
-0.653
-23.06%
1 gen 1997 anni
1.897
-0.282
-12.92%
1 gen 1998 anni
0.919
-0.977
-51.53%
1 gen 1999 anni
0.988
+0.068
7.43%
1 gen 2000 anni
0.927
-0.061
-6.15%
1 gen 2001 anni
1.073
+0.146
15.8%
1 gen 2002 anni
0.878
-0.195
-18.18%
1 gen 2003 anni
0.501
-0.377
-42.92%
1 gen 2004 anni
0.516
+0.014
2.86%
1 gen 2005 anni
0.52
+0.004
0.82%
1 gen 2006 anni
0.745
+0.225
43.37%
1 gen 2007 anni
0.663
-0.083
-11.11%
1 gen 2008 anni
0.427
-0.236
-35.59%
1 gen 2009 anni
1.071
+0.644
150.95%
1 gen 2010 anni
0.611
-0.46
-42.99%
1 gen 2011 anni
0.803
+0.193
31.58%
1 gen 2012 anni
0.773
-0.031
-3.8%
1 gen 2013 anni
0.908
+0.136
17.56%
1 gen 2014 anni
0.895
-0.014
-1.5%
1 gen 2015 anni
0.972
+0.077
8.58%
Classificazione dei paesi secondo i statistiche attuali per anni


Commenti: