29
/it/
it
AIzaSyAYiBZKx7MnpbEhh9jyipgxe19OcubqV5w
April 1, 2024
91023
Brazil
BRA
true
2
1
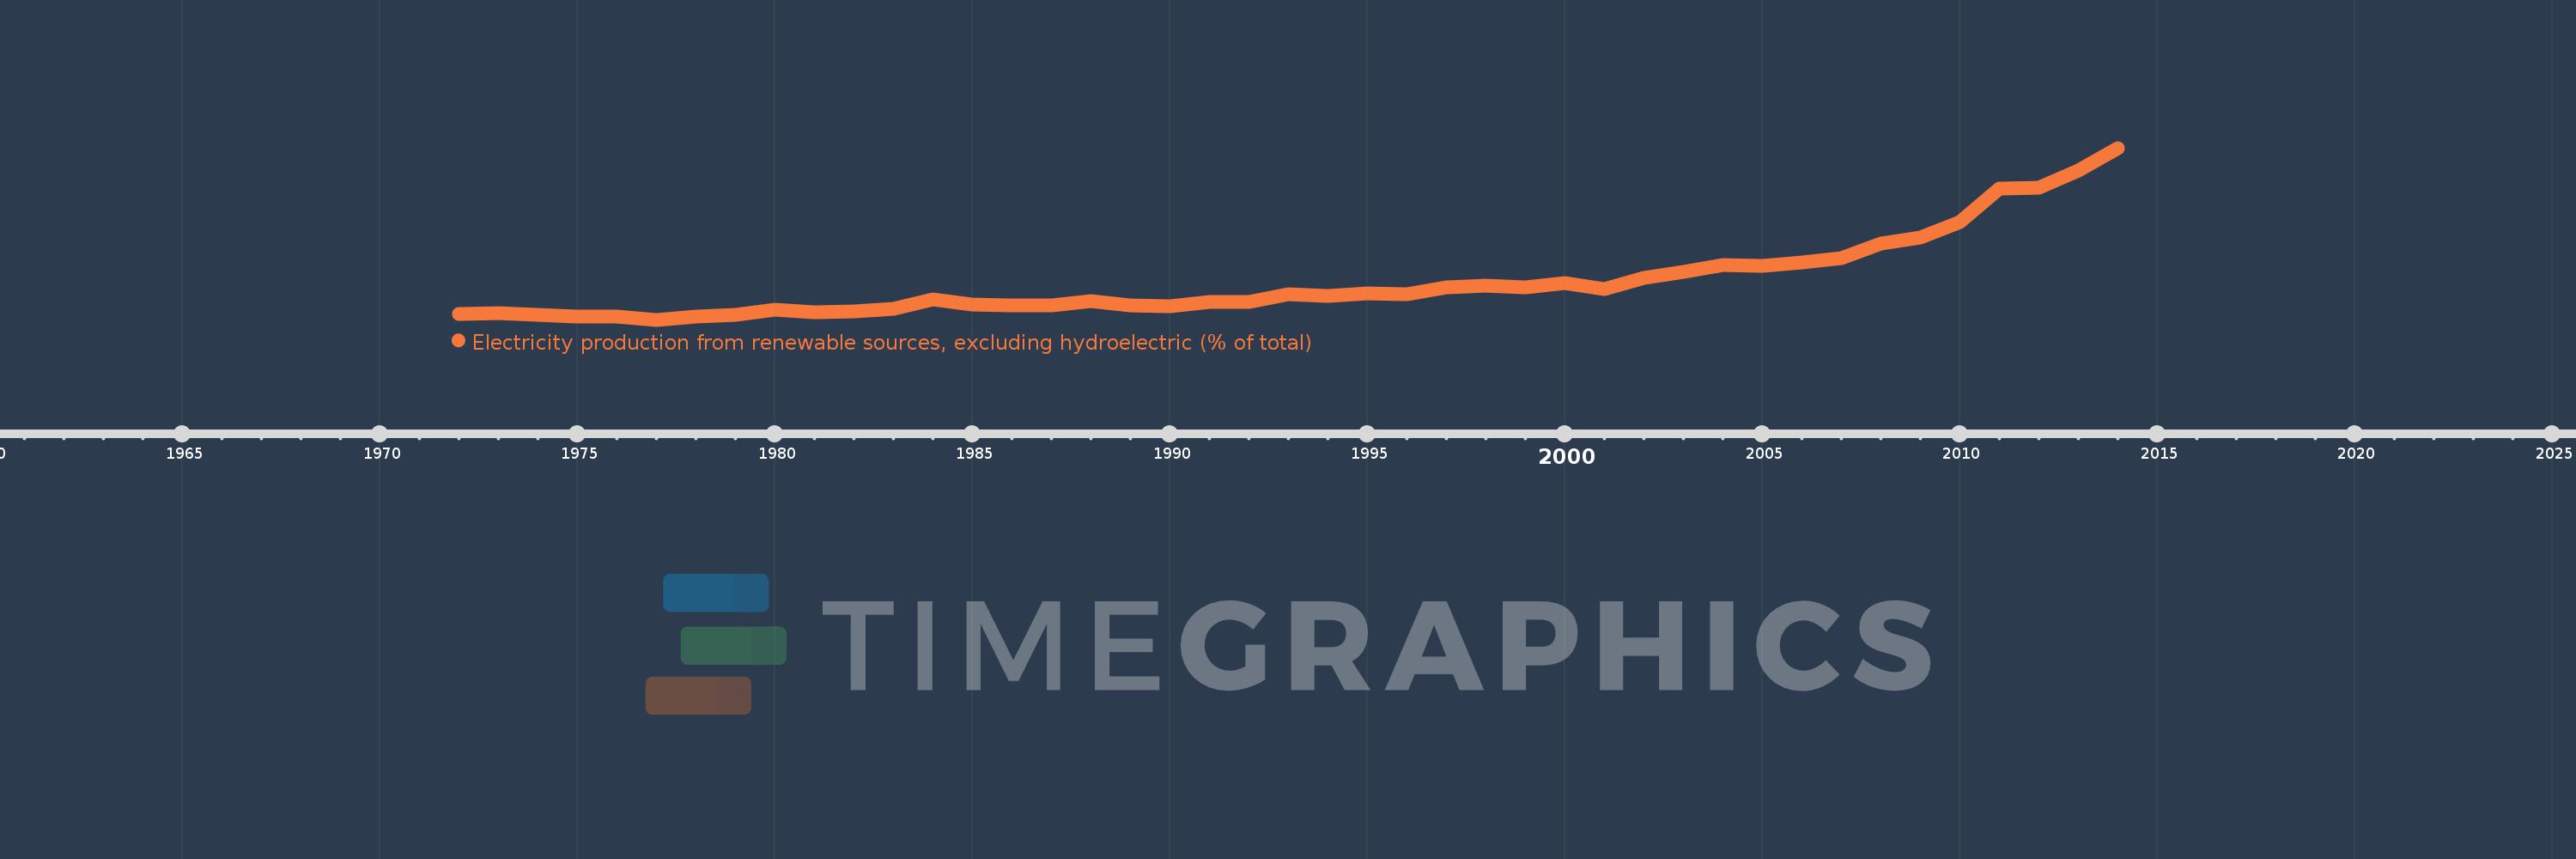
Electricity production from renewable sources, excluding hydroelectric (% of total)
2014,2013,2012,2011,2010,2009,2008,2007,2006,2005,2004,2003,2002,2001,2000,1999,1998,1997,1996,1995,1994,1993,1992,1991,1990,1989,1988,1987,1986,1985,1984,1983,1982,1981,1980,1979,1978,1977,1976,1975,1974,1973,1972
Queste statistiche in altri paesi:
AlbaniaAlgeriaAngolaArab WorldArgentinaArmeniaAustraliaAustriaAzerbaijanBahrainBangladeshBelarusBelgiumBeninBoliviaBosnia and HerzegovinaBotswanaBrazilBrunei DarussalamBulgariaCambodiaCameroonCanadaCentral Europe and the BalticsChileChinaColombiaCongo, Dem. Rep.Congo, Rep.Costa RicaCote d'IvoireCroatiaCubaCuracaoCyprusCzech RepublicDenmarkDominican RepublicEarly-demographic dividendEast Asia & PacificEast Asia & Pacific (excluding high income)East Asia & Pacific (IDA & IBRD countries)EcuadorEgypt, Arab Rep.El SalvadorEritreaEstoniaEthiopiaEuro areaEurope & Central AsiaEurope & Central Asia (excluding high income)Europe & Central Asia (IDA & IBRD countries)European UnionFinlandFragile and conflict affected situationsFranceGabonGeorgiaGermanyGhanaGibraltarGreeceGuatemalaHaitiHeavily indebted poor countries (HIPC)High incomeHondurasHong Kong SAR, ChinaHungaryIBRD onlyIcelandIDA & IBRD totalIDA blendIDA onlyIDA totalIndiaIndonesiaIran, Islamic Rep.IraqIrelandIsraelItalyJamaicaJapanJordanKazakhstanKenyaKorea, Dem. People’s Rep.Korea, Rep.KosovoKuwaitKyrgyz RepublicLate-demographic dividendLatin America & Caribbean Latin America & Caribbean (excluding high income)Latin America & the Caribbean (IDA & IBRD countries)LatviaLeast developed countries: UN classificationLebanonLibyaLithuaniaLow & middle incomeLower middle incomeLuxembourgMacedonia, FYRMalaysiaMaltaMauritiusMexicoMiddle East & North AfricaMiddle East & North Africa (excluding high income)Middle East & North Africa (IDA & IBRD countries)Middle incomeMoldovaMongoliaMontenegroMoroccoMozambiqueMyanmarNamibiaNepalNetherlandsNew ZealandNicaraguaNigerNigeriaNorth AmericaNorwayOECD membersOmanOther small statesPakistanPanamaParaguayPeruPhilippinesPolandPortugalPost-demographic dividendPre-demographic dividendQatarRomaniaRussian FederationSaudi ArabiaSenegalSerbiaSingaporeSlovak RepublicSloveniaSmall statesSouth AfricaSouth AsiaSouth Asia (IDA & IBRD)South SudanSpainSri LankaSub-Saharan Africa Sub-Saharan Africa (excluding high income)Sub-Saharan Africa (IDA & IBRD countries)SudanSwedenSwitzerlandSyrian Arab RepublicTajikistanTanzaniaThailandTogoTrinidad and TobagoTunisiaTurkeyTurkmenistanUkraineUnited Arab EmiratesUnited KingdomUnited StatesUpper middle incomeUruguayUzbekistanVenezuela, RBVietnamWorldYemen, Rep.ZambiaZimbabwe Linea del tempo:
Questa scala temporale mostra un grafico dal 1972 anno al 2014 anno. Brazil. I dati fino ad 1971 anno non disponibili. Il numero di osservazioni attuali secondo i date: 43.
La fonte (nome):
Indicatori dello sviluppo mondiale
La fonte (organizzazione):
IEA Statistics © OECD/IEA 2014 (http://www.iea.org/stats/index.asp), subject to https://www.iea.org/t&c/termsandconditions/
Categorie:
Energy & Mining, Climate Change, Environment
sono stati aggiornati
23 apr 2017 anni
Indicatori delle variazioni dei valori per anni
Minima:
0.96
1 gen 1977 anni
Massimo:
8.244
1 gen 2014 anni
Alla data di osservazione
Valore
Variazione assoluta
La variazione rispetto al valore precedente
1 gen 1972 anni
1.198
+1.198
0.0%
1 gen 1973 anni
1.244
+0.046
3.82%
1 gen 1974 anni
1.159
-0.085
-6.85%
1 gen 1975 anni
1.095
-0.064
-5.51%
1 gen 1976 anni
1.097
+0.002
0.21%
1 gen 1977 anni
0.96
-0.137
-12.53%
1 gen 1978 anni
1.106
+0.146
15.23%
1 gen 1979 anni
1.182
+0.076
6.85%
1 gen 1980 anni
1.4
+0.219
18.49%
1 gen 1981 anni
1.295
-0.105
-7.51%
1 gen 1982 anni
1.317
+0.022
1.72%
1 gen 1983 anni
1.432
+0.115
8.71%
1 gen 1984 anni
1.837
+0.405
28.28%
1 gen 1985 anni
1.59
-0.247
-13.45%
1 gen 1986 anni
1.583
-0.007
-0.43%
1 gen 1987 anni
1.58
-0.003
-0.21%
1 gen 1988 anni
1.753
+0.174
10.99%
1 gen 1989 anni
1.553
-0.2
-11.4%
1 gen 1990 anni
1.536
-0.017
-1.11%
1 gen 1991 anni
1.732
+0.196
12.74%
1 gen 1992 anni
1.706
-0.026
-1.48%
1 gen 1993 anni
2.027
+0.32
18.78%
1 gen 1994 anni
1.966
-0.061
-2.99%
1 gen 1995 anni
2.072
+0.106
5.39%
1 gen 1996 anni
2.03
-0.042
-2.04%
1 gen 1997 anni
2.319
+0.289
14.24%
1 gen 1998 anni
2.397
+0.078
3.38%
1 gen 1999 anni
2.334
-0.063
-2.63%
1 gen 2000 anni
2.5
+0.166
7.11%
1 gen 2001 anni
2.249
-0.251
-10.05%
1 gen 2002 anni
2.744
+0.496
22.04%
1 gen 2003 anni
2.974
+0.23
8.37%
1 gen 2004 anni
3.281
+0.307
10.34%
1 gen 2005 anni
3.236
-0.046
-1.39%
1 gen 2006 anni
3.395
+0.16
4.93%
1 gen 2007 anni
3.568
+0.172
5.07%
1 gen 2008 anni
4.194
+0.627
17.56%
1 gen 2009 anni
4.46
+0.266
6.35%
1 gen 2010 anni
5.115
+0.654
14.67%
1 gen 2011 anni
6.529
+1.414
27.65%
1 gen 2012 anni
6.57
+0.042
0.64%
1 gen 2013 anni
7.3
+0.73
11.1%
1 gen 2014 anni
8.244
+0.944
12.94%
Classificazione dei paesi secondo i statistiche attuali per anni


Commenti: