29
/it/
it
AIzaSyAYiBZKx7MnpbEhh9jyipgxe19OcubqV5w
April 1, 2024
195431
Mexico
MEX
true
2
1
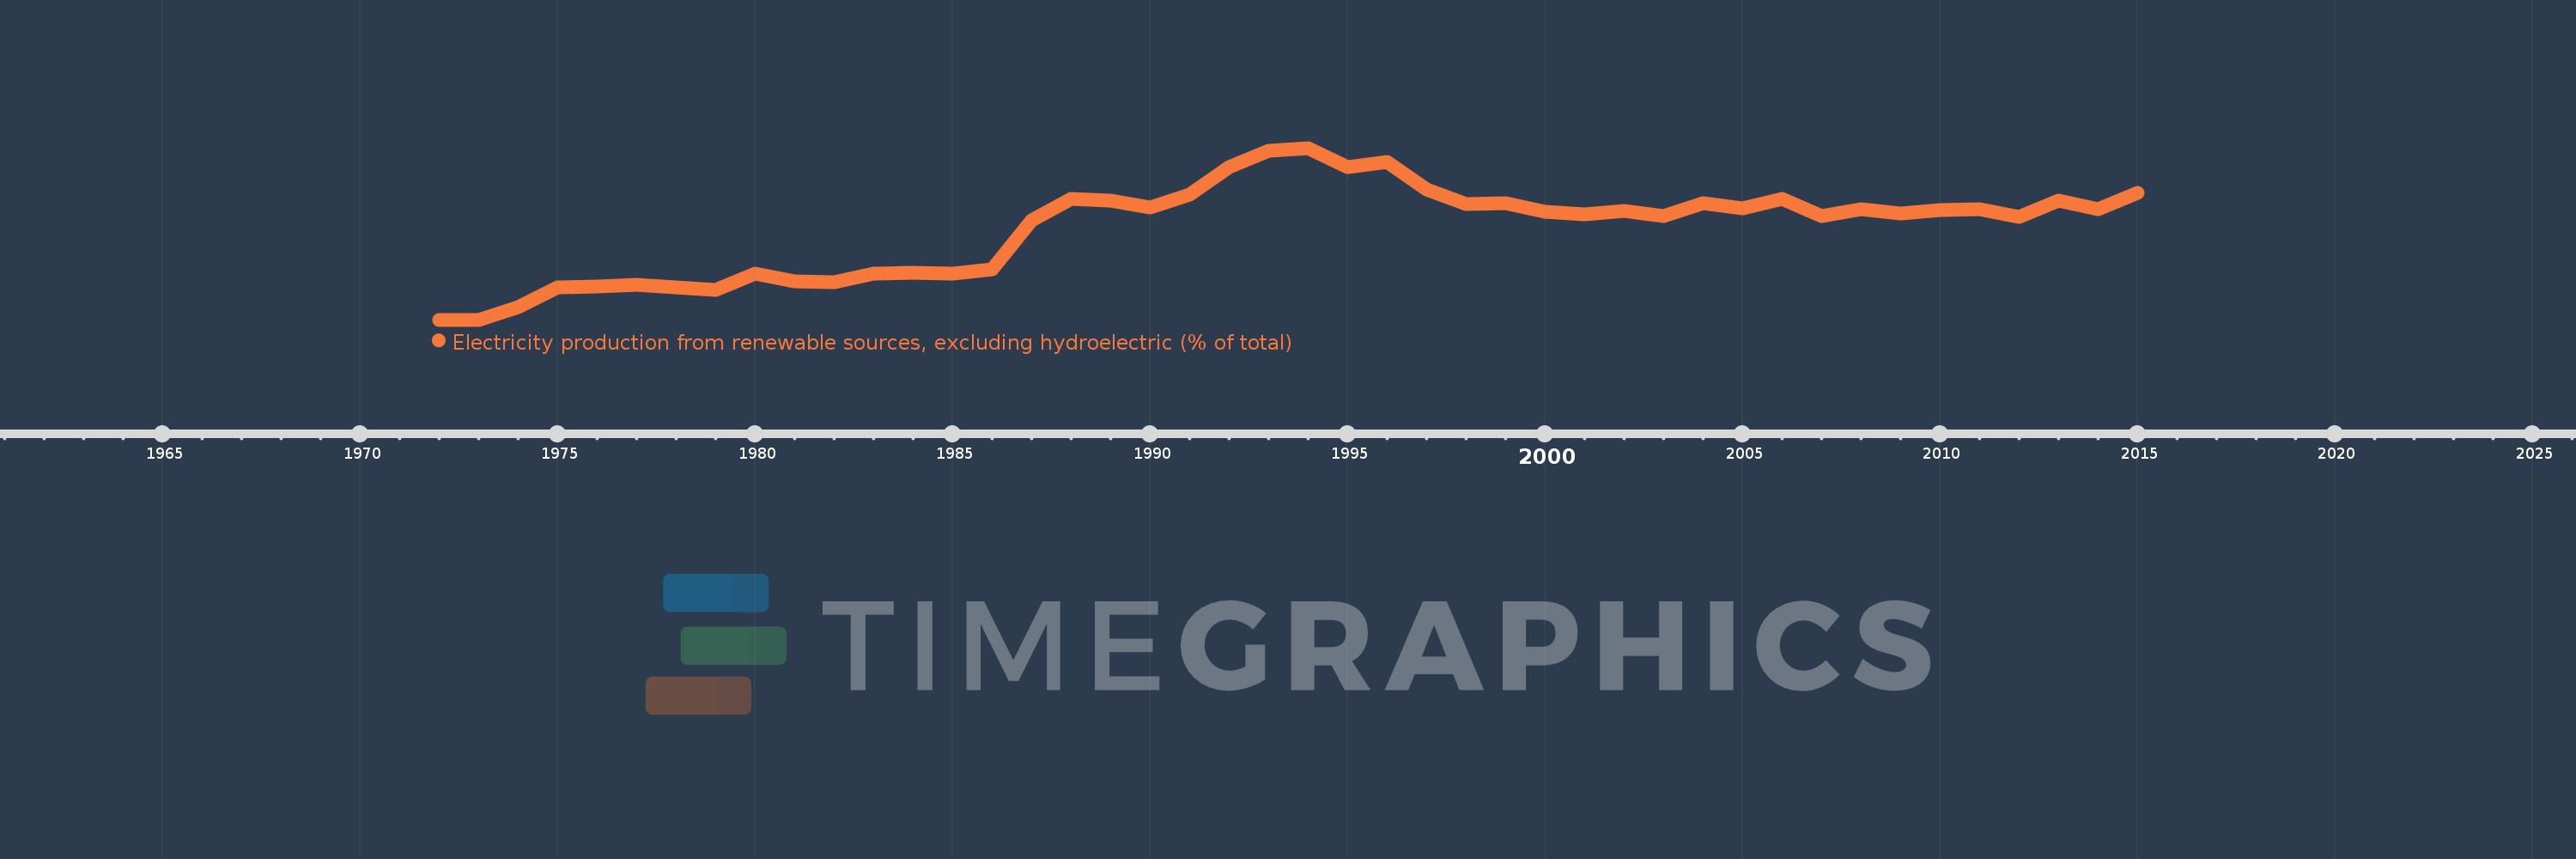
Electricity production from renewable sources, excluding hydroelectric (% of total)
2015,2014,2013,2012,2011,2010,2009,2008,2007,2006,2005,2004,2003,2002,2001,2000,1999,1998,1997,1996,1995,1994,1993,1992,1991,1990,1989,1988,1987,1986,1985,1984,1983,1982,1981,1980,1979,1978,1977,1976,1975,1974,1973,1972
Queste statistiche in altri paesi:
AlbaniaAlgeriaAngolaArab WorldArgentinaArmeniaAustraliaAustriaAzerbaijanBahrainBangladeshBelarusBelgiumBeninBoliviaBosnia and HerzegovinaBotswanaBrazilBrunei DarussalamBulgariaCambodiaCameroonCanadaCentral Europe and the BalticsChileChinaColombiaCongo, Dem. Rep.Congo, Rep.Costa RicaCote d'IvoireCroatiaCubaCuracaoCyprusCzech RepublicDenmarkDominican RepublicEarly-demographic dividendEast Asia & PacificEast Asia & Pacific (excluding high income)East Asia & Pacific (IDA & IBRD countries)EcuadorEgypt, Arab Rep.El SalvadorEritreaEstoniaEthiopiaEuro areaEurope & Central AsiaEurope & Central Asia (excluding high income)Europe & Central Asia (IDA & IBRD countries)European UnionFinlandFragile and conflict affected situationsFranceGabonGeorgiaGermanyGhanaGibraltarGreeceGuatemalaHaitiHeavily indebted poor countries (HIPC)High incomeHondurasHong Kong SAR, ChinaHungaryIBRD onlyIcelandIDA & IBRD totalIDA blendIDA onlyIDA totalIndiaIndonesiaIran, Islamic Rep.IraqIrelandIsraelItalyJamaicaJapanJordanKazakhstanKenyaKorea, Dem. People’s Rep.Korea, Rep.KosovoKuwaitKyrgyz RepublicLate-demographic dividendLatin America & Caribbean Latin America & Caribbean (excluding high income)Latin America & the Caribbean (IDA & IBRD countries)LatviaLeast developed countries: UN classificationLebanonLibyaLithuaniaLow & middle incomeLower middle incomeLuxembourgMacedonia, FYRMalaysiaMaltaMauritiusMexicoMiddle East & North AfricaMiddle East & North Africa (excluding high income)Middle East & North Africa (IDA & IBRD countries)Middle incomeMoldovaMongoliaMontenegroMoroccoMozambiqueMyanmarNamibiaNepalNetherlandsNew ZealandNicaraguaNigerNigeriaNorth AmericaNorwayOECD membersOmanOther small statesPakistanPanamaParaguayPeruPhilippinesPolandPortugalPost-demographic dividendPre-demographic dividendQatarRomaniaRussian FederationSaudi ArabiaSenegalSerbiaSingaporeSlovak RepublicSloveniaSmall statesSouth AfricaSouth AsiaSouth Asia (IDA & IBRD)South SudanSpainSri LankaSub-Saharan Africa Sub-Saharan Africa (excluding high income)Sub-Saharan Africa (IDA & IBRD countries)SudanSwedenSwitzerlandSyrian Arab RepublicTajikistanTanzaniaThailandTogoTrinidad and TobagoTunisiaTurkeyTurkmenistanUkraineUnited Arab EmiratesUnited KingdomUnited StatesUpper middle incomeUruguayUzbekistanVenezuela, RBVietnamWorldYemen, Rep.ZambiaZimbabwe Linea del tempo:
Questa scala temporale mostra un grafico dal 1972 anno al 2015 anno. Mexico. I dati fino ad 1971 anno non disponibili. Il numero di osservazioni attuali secondo i date: 44.
La fonte (nome):
Indicatori dello sviluppo mondiale
La fonte (organizzazione):
IEA Statistics © OECD/IEA 2014 (http://www.iea.org/stats/index.asp), subject to https://www.iea.org/t&c/termsandconditions/
Categorie:
Energy & Mining, Climate Change, Environment
sono stati aggiornati
23 apr 2017 anni
Indicatori delle variazioni dei valori per anni
Minima:
0.0
1 gen 1972 anni
Massimo:
6.059
1 gen 1994 anni
Alla data di osservazione
Valore
Variazione assoluta
La variazione rispetto al valore precedente
1 gen 1972 anni
0.0
0.0
0.0%
1 gen 1974 anni
0.434
+0.434
%
1 gen 1975 anni
1.13
+0.696
160.32%
1 gen 1976 anni
1.179
+0.05
4.39%
1 gen 1977 anni
1.218
+0.039
3.31%
1 gen 1978 anni
1.133
-0.086
-7.02%
1 gen 1979 anni
1.049
-0.084
-7.37%
1 gen 1980 anni
1.641
+0.592
56.42%
1 gen 1981 anni
1.366
-0.275
-16.75%
1 gen 1982 anni
1.318
-0.049
-3.57%
1 gen 1983 anni
1.619
+0.301
22.87%
1 gen 1984 anni
1.652
+0.033
2.07%
1 gen 1985 anni
1.638
-0.014
-0.87%
1 gen 1986 anni
1.765
+0.127
7.73%
1 gen 1987 anni
3.494
+1.729
98.0%
1 gen 1988 anni
4.248
+0.754
21.57%
1 gen 1989 anni
4.217
-0.031
-0.73%
1 gen 1990 anni
3.972
-0.245
-5.82%
1 gen 1991 anni
4.425
+0.453
11.42%
1 gen 1992 anni
5.391
+0.966
21.82%
1 gen 1993 anni
5.959
+0.568
10.53%
1 gen 1994 anni
6.059
+0.101
1.69%
1 gen 1995 anni
5.396
-0.664
-10.95%
1 gen 1996 anni
5.569
+0.173
3.21%
1 gen 1997 anni
4.595
-0.974
-17.49%
1 gen 1998 anni
4.086
-0.51
-11.09%
1 gen 1999 anni
4.106
+0.021
0.51%
1 gen 2000 anni
3.821
-0.286
-6.96%
1 gen 2001 anni
3.722
-0.099
-2.58%
1 gen 2002 anni
3.824
+0.102
2.74%
1 gen 2003 anni
3.661
-0.162
-4.25%
1 gen 2004 anni
4.1
+0.439
11.98%
1 gen 2005 anni
3.921
-0.179
-4.38%
1 gen 2006 anni
4.266
+0.345
8.81%
1 gen 2007 anni
3.642
-0.624
-14.63%
1 gen 2008 anni
3.901
+0.26
7.13%
1 gen 2009 anni
3.743
-0.158
-4.06%
1 gen 2010 anni
3.856
+0.113
3.02%
1 gen 2011 anni
3.902
+0.046
1.2%
1 gen 2012 anni
3.616
-0.286
-7.33%
1 gen 2013 anni
4.193
+0.577
15.95%
1 gen 2014 anni
3.885
-0.308
-7.34%
1 gen 2015 anni
4.462
+0.577
14.85%
Classificazione dei paesi secondo i statistiche attuali per anni


Commenti: