29
/it/
it
AIzaSyAYiBZKx7MnpbEhh9jyipgxe19OcubqV5w
April 1, 2024
38907
IDA only
IDX
false
2
1
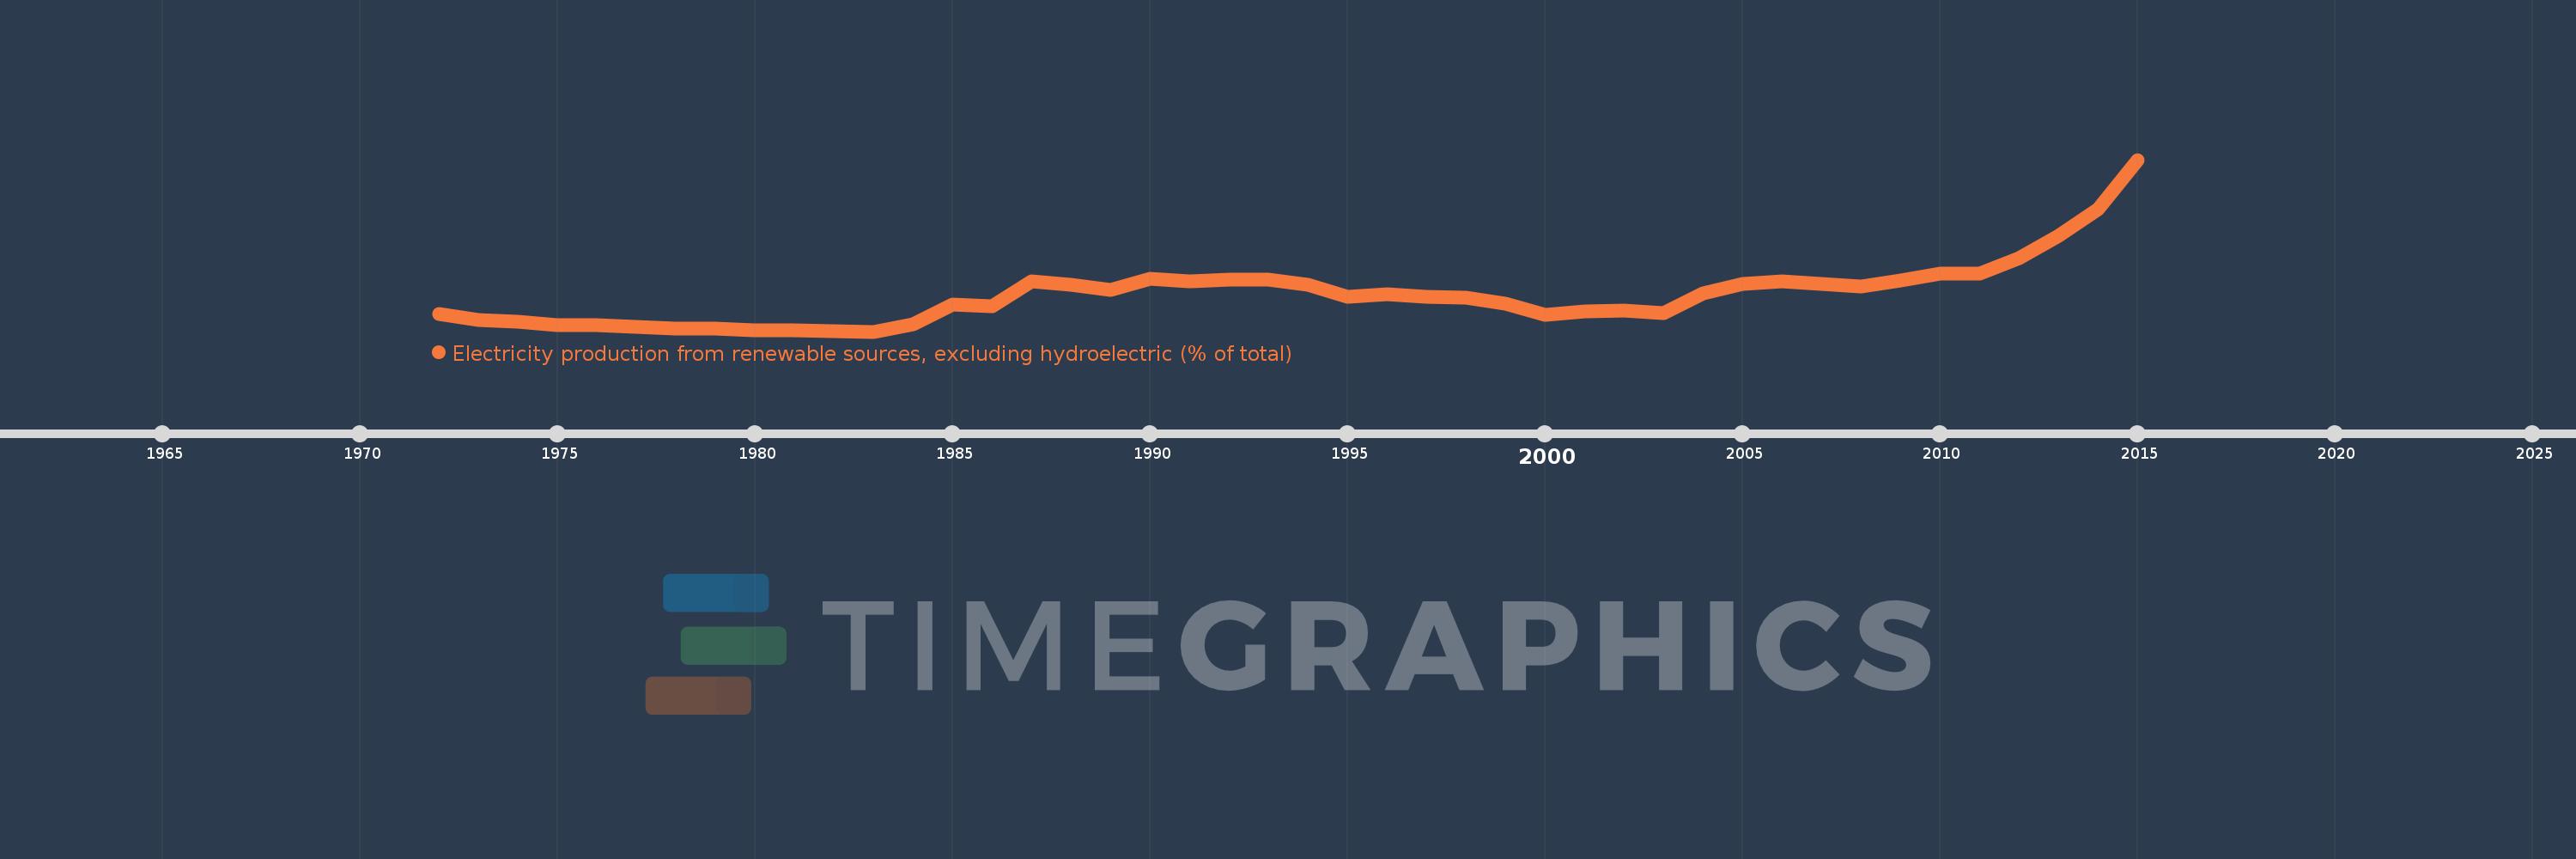
Electricity production from renewable sources, excluding hydroelectric (% of total)
2015,2014,2013,2012,2011,2010,2009,2008,2007,2006,2005,2004,2003,2002,2001,2000,1999,1998,1997,1996,1995,1994,1993,1992,1991,1990,1989,1988,1987,1986,1985,1984,1983,1982,1981,1980,1979,1978,1977,1976,1975,1974,1973,1972
Queste statistiche in altri paesi:
AlbaniaAlgeriaAngolaArab WorldArgentinaArmeniaAustraliaAustriaAzerbaijanBahrainBangladeshBelarusBelgiumBeninBoliviaBosnia and HerzegovinaBotswanaBrazilBrunei DarussalamBulgariaCambodiaCameroonCanadaCentral Europe and the BalticsChileChinaColombiaCongo, Dem. Rep.Congo, Rep.Costa RicaCote d'IvoireCroatiaCubaCuracaoCyprusCzech RepublicDenmarkDominican RepublicEarly-demographic dividendEast Asia & PacificEast Asia & Pacific (excluding high income)East Asia & Pacific (IDA & IBRD countries)EcuadorEgypt, Arab Rep.El SalvadorEritreaEstoniaEthiopiaEuro areaEurope & Central AsiaEurope & Central Asia (excluding high income)Europe & Central Asia (IDA & IBRD countries)European UnionFinlandFragile and conflict affected situationsFranceGabonGeorgiaGermanyGhanaGibraltarGreeceGuatemalaHaitiHeavily indebted poor countries (HIPC)High incomeHondurasHong Kong SAR, ChinaHungaryIBRD onlyIcelandIDA & IBRD totalIDA blendIDA onlyIDA totalIndiaIndonesiaIran, Islamic Rep.IraqIrelandIsraelItalyJamaicaJapanJordanKazakhstanKenyaKorea, Dem. People’s Rep.Korea, Rep.KosovoKuwaitKyrgyz RepublicLate-demographic dividendLatin America & Caribbean Latin America & Caribbean (excluding high income)Latin America & the Caribbean (IDA & IBRD countries)LatviaLeast developed countries: UN classificationLebanonLibyaLithuaniaLow & middle incomeLower middle incomeLuxembourgMacedonia, FYRMalaysiaMaltaMauritiusMexicoMiddle East & North AfricaMiddle East & North Africa (excluding high income)Middle East & North Africa (IDA & IBRD countries)Middle incomeMoldovaMongoliaMontenegroMoroccoMozambiqueMyanmarNamibiaNepalNetherlandsNew ZealandNicaraguaNigerNigeriaNorth AmericaNorwayOECD membersOmanOther small statesPakistanPanamaParaguayPeruPhilippinesPolandPortugalPost-demographic dividendPre-demographic dividendQatarRomaniaRussian FederationSaudi ArabiaSenegalSerbiaSingaporeSlovak RepublicSloveniaSmall statesSouth AfricaSouth AsiaSouth Asia (IDA & IBRD)South SudanSpainSri LankaSub-Saharan Africa Sub-Saharan Africa (excluding high income)Sub-Saharan Africa (IDA & IBRD countries)SudanSwedenSwitzerlandSyrian Arab RepublicTajikistanTanzaniaThailandTogoTrinidad and TobagoTunisiaTurkeyTurkmenistanUkraineUnited Arab EmiratesUnited KingdomUnited StatesUpper middle incomeUruguayUzbekistanVenezuela, RBVietnamWorldYemen, Rep.ZambiaZimbabwe Linea del tempo:
Questa scala temporale mostra un grafico dal 1972 anno al 2015 anno. IDA only. I dati fino ad 1971 anno non disponibili. Il numero di osservazioni attuali secondo i date: 44.
La fonte (nome):
Indicatori dello sviluppo mondiale
La fonte (organizzazione):
IEA Statistics © OECD/IEA 2014 (http://www.iea.org/stats/index.asp), subject to https://www.iea.org/t&c/termsandconditions/
Categorie:
Energy & Mining, Climate Change, Environment
sono stati aggiornati
23 apr 2017 anni
Indicatori delle variazioni dei valori per anni
Minima:
0.277
1 gen 1983 anni
Massimo:
2.524
1 gen 2015 anni
Alla data di osservazione
Valore
Variazione assoluta
La variazione rispetto al valore precedente
1 gen 1972 anni
0.504
+0.504
0.0%
1 gen 1973 anni
0.429
-0.075
-14.98%
1 gen 1974 anni
0.404
-0.024
-5.71%
1 gen 1975 anni
0.364
-0.04
-10.0%
1 gen 1976 anni
0.358
-0.006
-1.6%
1 gen 1977 anni
0.338
-0.02
-5.47%
1 gen 1978 anni
0.314
-0.025
-7.24%
1 gen 1979 anni
0.32
+0.006
1.84%
1 gen 1980 anni
0.296
-0.024
-7.45%
1 gen 1981 anni
0.293
-0.002
-0.83%
1 gen 1982 anni
0.283
-0.011
-3.61%
1 gen 1983 anni
0.277
-0.006
-1.99%
1 gen 1984 anni
0.373
+0.096
34.79%
1 gen 1985 anni
0.635
+0.262
70.06%
1 gen 1986 anni
0.614
-0.021
-3.33%
1 gen 1987 anni
0.937
+0.323
52.59%
1 gen 1988 anni
0.886
-0.051
-5.43%
1 gen 1989 anni
0.826
-0.06
-6.81%
1 gen 1990 anni
0.966
+0.14
16.96%
1 gen 1991 anni
0.933
-0.033
-3.41%
1 gen 1992 anni
0.955
+0.022
2.38%
1 gen 1993 anni
0.956
+0.001
0.12%
1 gen 1994 anni
0.884
-0.072
-7.5%
1 gen 1995 anni
0.728
-0.157
-17.74%
1 gen 1996 anni
0.771
+0.044
6.03%
1 gen 1997 anni
0.737
-0.035
-4.48%
1 gen 1998 anni
0.716
-0.021
-2.82%
1 gen 1999 anni
0.641
-0.076
-10.55%
1 gen 2000 anni
0.492
-0.149
-23.22%
1 gen 2001 anni
0.543
+0.051
10.31%
1 gen 2002 anni
0.552
+0.009
1.74%
1 gen 2003 anni
0.52
-0.032
-5.85%
1 gen 2004 anni
0.775
+0.256
49.2%
1 gen 2005 anni
0.906
+0.13
16.79%
1 gen 2006 anni
0.937
+0.031
3.42%
1 gen 2007 anni
0.896
-0.041
-4.34%
1 gen 2008 anni
0.872
-0.024
-2.71%
1 gen 2009 anni
0.949
+0.077
8.87%
1 gen 2010 anni
1.03
+0.081
8.49%
1 gen 2011 anni
1.039
+0.01
0.96%
1 gen 2012 anni
1.232
+0.193
18.54%
1 gen 2013 anni
1.53
+0.297
24.13%
1 gen 2014 anni
1.874
+0.344
22.49%
1 gen 2015 anni
2.524
+0.651
34.74%
Classificazione dei paesi secondo i statistiche attuali per anni


Commenti: