29
/it/
it
AIzaSyAYiBZKx7MnpbEhh9jyipgxe19OcubqV5w
April 1, 2024
90716
Brazil
BRA
true
2
1
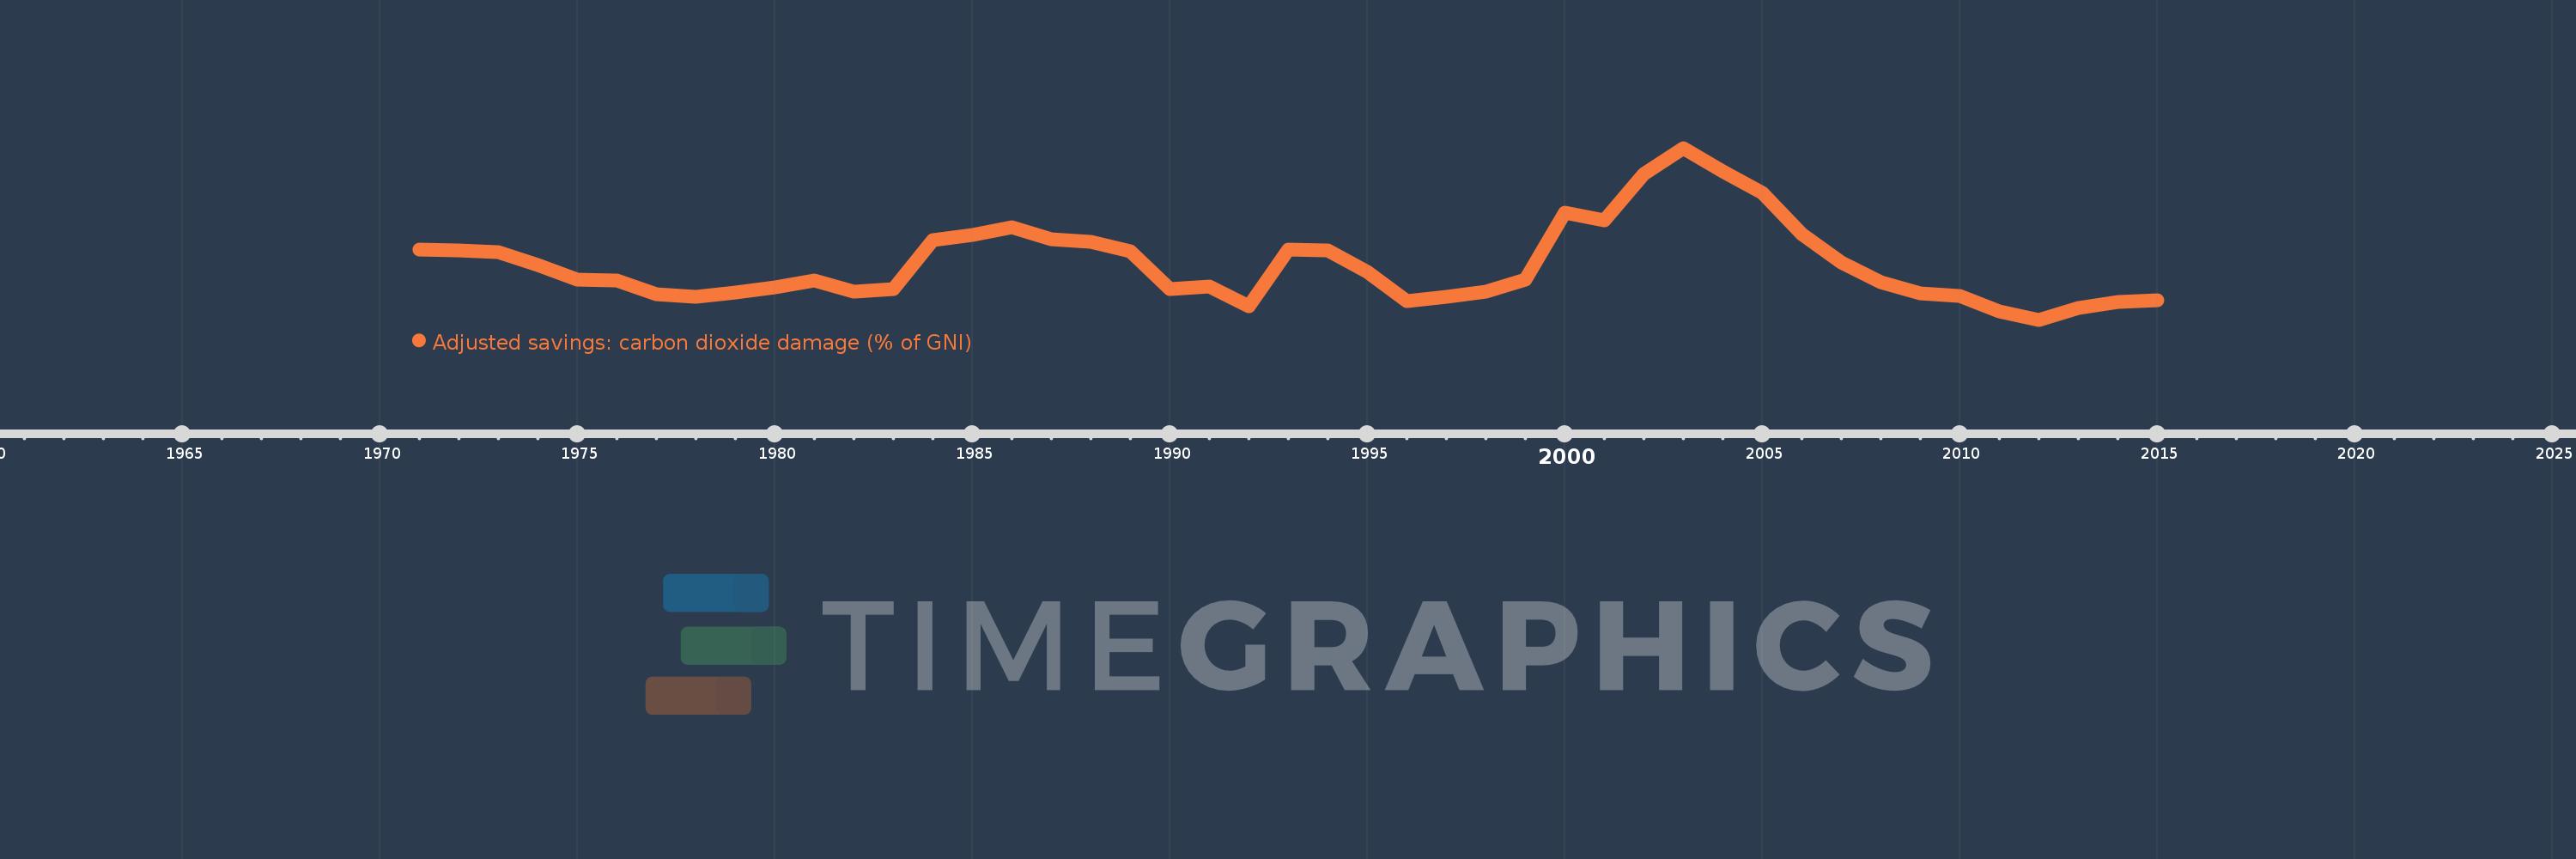
Adjusted savings: carbon dioxide damage (% of GNI)
2015,2014,2013,2012,2011,2010,2009,2008,2007,2006,2005,2004,2003,2002,2001,2000,1999,1998,1997,1996,1995,1994,1993,1992,1991,1990,1989,1988,1987,1986,1985,1984,1983,1982,1981,1980,1979,1978,1977,1976,1975,1974,1973,1972,1971
Queste statistiche in altri paesi:
AfghanistanAlbaniaAlgeriaAndorraAngolaAntigua and BarbudaArab WorldArgentinaArmeniaAustraliaAustriaAzerbaijanBahamas, TheBahrainBangladeshBarbadosBelarusBelgiumBelizeBeninBermudaBhutanBoliviaBosnia and HerzegovinaBotswanaBrazilBrunei DarussalamBulgariaBurkina FasoBurundiCabo VerdeCambodiaCameroonCanadaCaribbean small statesCentral African RepublicCentral Europe and the BalticsChadChileChinaColombiaComorosCongo, Dem. Rep.Congo, Rep.Costa RicaCote d'IvoireCroatiaCubaCyprusCzech RepublicDenmarkDjiboutiDominicaDominican RepublicEarly-demographic dividendEast Asia & PacificEast Asia & Pacific (excluding high income)East Asia & Pacific (IDA & IBRD countries)EcuadorEgypt, Arab Rep.El SalvadorEquatorial GuineaEritreaEstoniaEthiopiaEuro areaEurope & Central AsiaEurope & Central Asia (excluding high income)Europe & Central Asia (IDA & IBRD countries)European UnionFaroe IslandsFijiFinlandFragile and conflict affected situationsFranceFrench PolynesiaGabonGambia, TheGeorgiaGermanyGhanaGreeceGreenlandGrenadaGuatemalaGuineaGuinea-BissauGuyanaHaitiHeavily indebted poor countries (HIPC)High incomeHondurasHong Kong SAR, ChinaHungaryIBRD onlyIcelandIDA & IBRD totalIDA blendIDA onlyIDA totalIndiaIndonesiaIran, Islamic Rep.IraqIrelandIsraelItalyJamaicaJapanJordanKazakhstanKenyaKiribatiKorea, Rep.KuwaitKyrgyz RepublicLao PDRLate-demographic dividendLatin America & Caribbean Latin America & Caribbean (excluding high income)Latin America & the Caribbean (IDA & IBRD countries)LatviaLeast developed countries: UN classificationLebanonLesothoLiberiaLibyaLiechtensteinLithuaniaLow & middle incomeLow incomeLower middle incomeLuxembourgMacao SAR, ChinaMacedonia, FYRMadagascarMalawiMalaysiaMaldivesMaliMaltaMarshall IslandsMauritaniaMauritiusMexicoMicronesia, Fed. Sts.Middle East & North AfricaMiddle East & North Africa (excluding high income)Middle East & North Africa (IDA & IBRD countries)Middle incomeMoldovaMongoliaMontenegroMoroccoMozambiqueNamibiaNepalNetherlandsNew CaledoniaNew ZealandNicaraguaNigerNigeriaNorth AmericaNorwayOECD membersOmanOther small statesPacific island small statesPakistanPalauPanamaPapua New GuineaParaguayPeruPhilippinesPolandPortugalPost-demographic dividendPre-demographic dividendQatarRomaniaRussian FederationRwandaSamoaSao Tome and PrincipeSaudi ArabiaSenegalSerbiaSeychellesSierra LeoneSingaporeSlovak RepublicSloveniaSmall statesSolomon IslandsSouth AfricaSouth AsiaSouth Asia (IDA & IBRD)SpainSri LankaSt. Kitts and NevisSt. LuciaSt. Vincent and the GrenadinesSub-Saharan Africa Sub-Saharan Africa (excluding high income)Sub-Saharan Africa (IDA & IBRD countries)SudanSurinameSwazilandSwedenSwitzerlandSyrian Arab RepublicTajikistanTanzaniaThailandTimor-LesteTogoTongaTrinidad and TobagoTunisiaTurkeyTurkmenistanUgandaUkraineUnited Arab EmiratesUnited KingdomUnited StatesUpper middle incomeUruguayUzbekistanVanuatuVenezuela, RBVietnamWest Bank and GazaWorldYemen, Rep.ZambiaZimbabwe Linea del tempo:
Questa scala temporale mostra un grafico dal 1971 anno al 2015 anno. Brazil. I dati fino ad 1970 anno non disponibili. Il numero di osservazioni attuali secondo i date: 45.
La fonte (nome):
Indicatori dello sviluppo mondiale
La fonte (organizzazione):
World Bank staff estimates based on Samuel Fankhauser's "Valuing Climate Change: The Economics of the Greenhouse" (1995).
Categorie:
Economy & Growth, Environment
sono stati aggiornati
23 apr 2017 anni
Indicatori delle variazioni dei valori per anni
Minima:
0.166
1 gen 2012 anni
Massimo:
0.494
1 gen 2003 anni
Alla data di osservazione
Valore
Variazione assoluta
La variazione rispetto al valore precedente
1 gen 1971 anni
0.3
+0.3
0.0%
1 gen 1972 anni
0.299
-0.001
-0.25%
1 gen 1973 anni
0.295
-0.004
-1.4%
1 gen 1974 anni
0.27
-0.025
-8.45%
1 gen 1975 anni
0.242
-0.028
-10.28%
1 gen 1976 anni
0.241
-0.001
-0.4%
1 gen 1977 anni
0.215
-0.027
-11.1%
1 gen 1978 anni
0.21
-0.004
-2.06%
1 gen 1979 anni
0.218
+0.008
3.87%
1 gen 1980 anni
0.228
+0.01
4.41%
1 gen 1981 anni
0.241
+0.013
5.55%
1 gen 1982 anni
0.22
-0.021
-8.61%
1 gen 1983 anni
0.224
+0.004
1.81%
1 gen 1984 anni
0.318
+0.094
42.07%
1 gen 1985 anni
0.328
+0.01
3.06%
1 gen 1986 anni
0.343
+0.015
4.71%
1 gen 1987 anni
0.32
-0.023
-6.68%
1 gen 1988 anni
0.314
-0.006
-1.98%
1 gen 1989 anni
0.296
-0.018
-5.76%
1 gen 1990 anni
0.225
-0.071
-24.01%
1 gen 1991 anni
0.23
+0.005
2.13%
1 gen 1992 anni
0.192
-0.037
-16.25%
1 gen 1993 anni
0.3
+0.108
56.14%
1 gen 1994 anni
0.299
-0.001
-0.35%
1 gen 1995 anni
0.258
-0.041
-13.76%
1 gen 1996 anni
0.201
-0.056
-21.9%
1 gen 1997 anni
0.21
+0.008
4.0%
1 gen 1998 anni
0.22
+0.011
5.11%
1 gen 1999 anni
0.242
+0.022
10.06%
1 gen 2000 anni
0.371
+0.129
53.05%
1 gen 2001 anni
0.356
-0.015
-3.94%
1 gen 2002 anni
0.445
+0.089
24.92%
1 gen 2003 anni
0.494
+0.049
11.08%
1 gen 2004 anni
0.45
-0.045
-9.09%
1 gen 2005 anni
0.408
-0.042
-9.33%
1 gen 2006 anni
0.329
-0.079
-19.38%
1 gen 2007 anni
0.276
-0.052
-15.91%
1 gen 2008 anni
0.238
-0.039
-13.99%
1 gen 2009 anni
0.217
-0.021
-8.81%
1 gen 2010 anni
0.212
-0.004
-1.98%
1 gen 2011 anni
0.182
-0.031
-14.52%
1 gen 2012 anni
0.166
-0.016
-8.76%
1 gen 2013 anni
0.188
+0.022
13.22%
1 gen 2014 anni
0.2
+0.013
6.75%
1 gen 2015 anni
0.204
+0.004
2.11%
Classificazione dei paesi secondo i statistiche attuali per anni


Commenti: