29
/it/
it
AIzaSyAYiBZKx7MnpbEhh9jyipgxe19OcubqV5w
April 1, 2024
49767
Middle East & North Africa (IDA & IBRD countries)
TMN
false
2
1
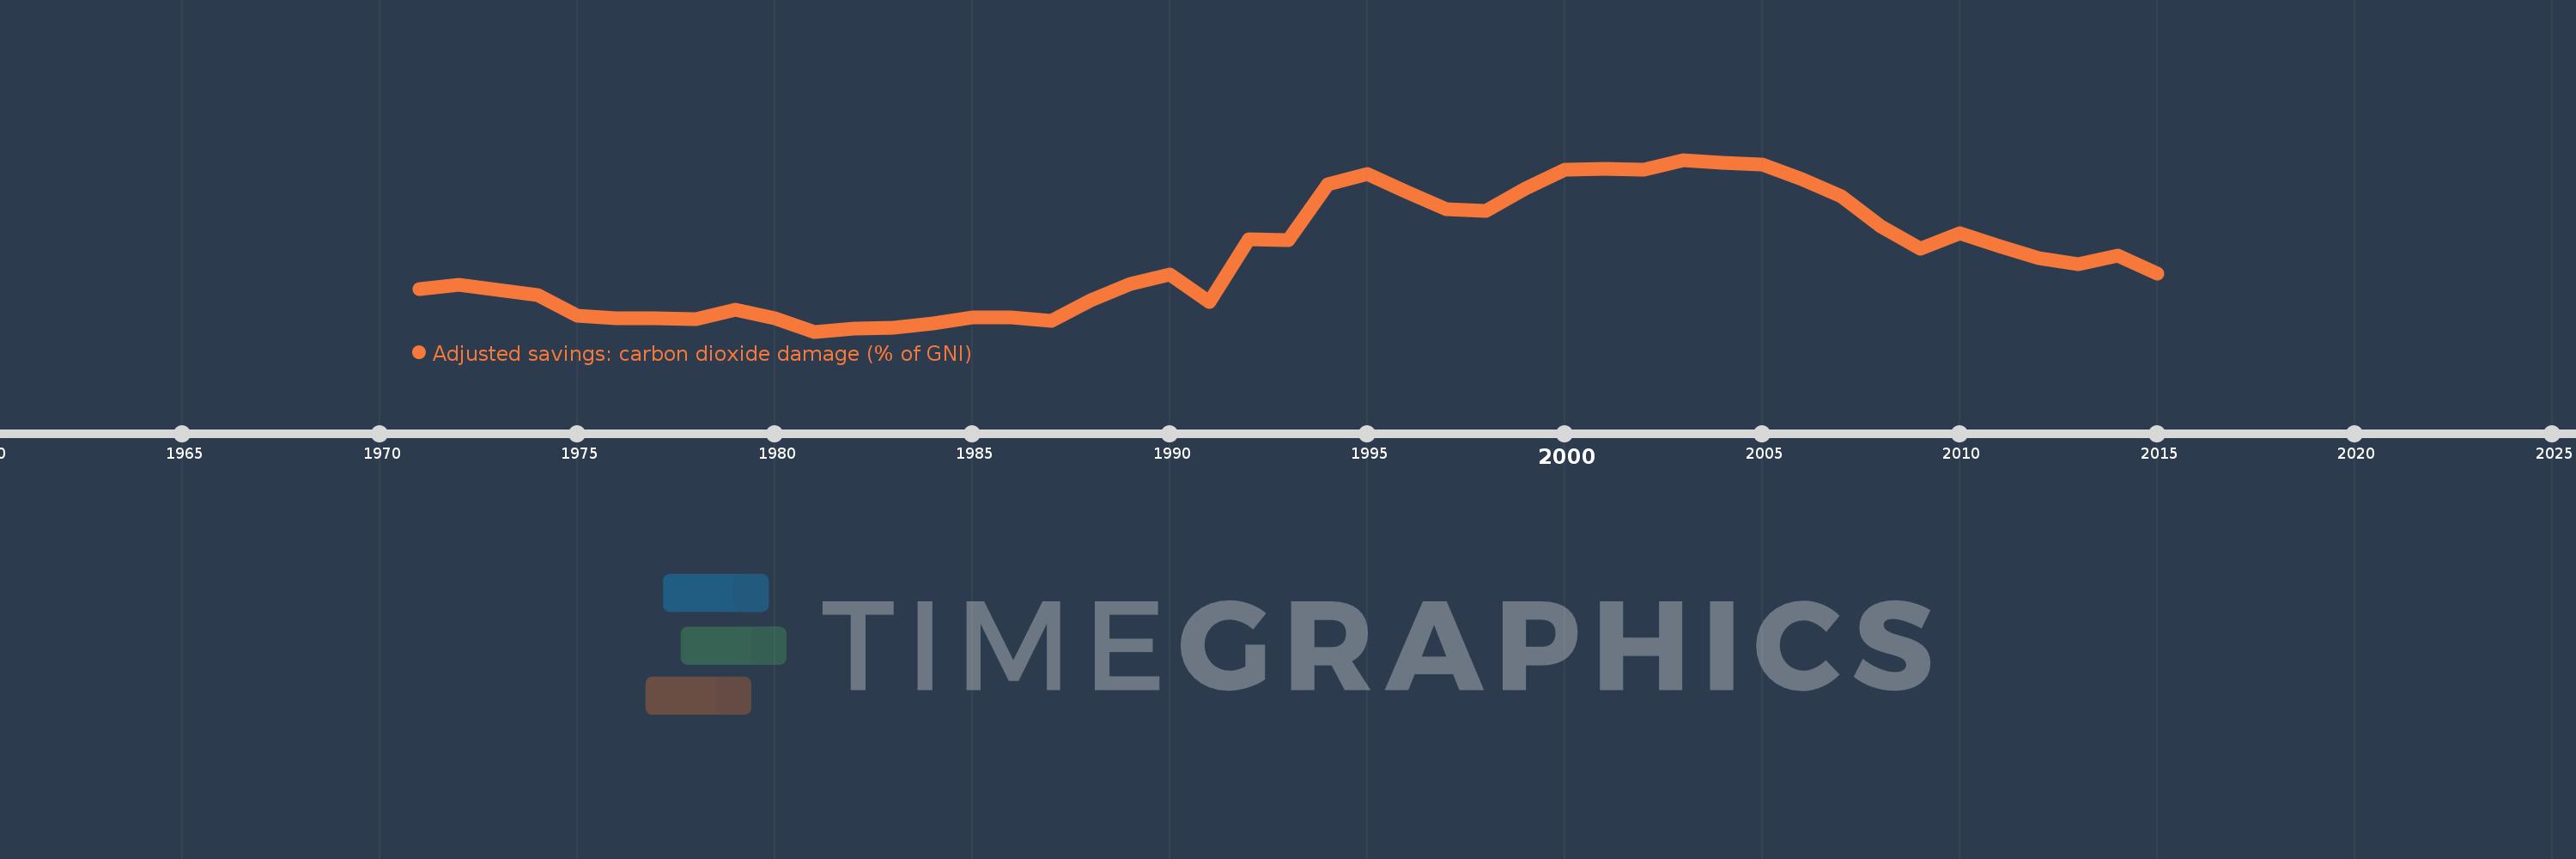
Adjusted savings: carbon dioxide damage (% of GNI)
2015,2014,2013,2012,2011,2010,2009,2008,2007,2006,2005,2004,2003,2002,2001,2000,1999,1998,1997,1996,1995,1994,1993,1992,1991,1990,1989,1988,1987,1986,1985,1984,1983,1982,1981,1980,1979,1978,1977,1976,1975,1974,1973,1972,1971
Queste statistiche in altri paesi:
AfghanistanAlbaniaAlgeriaAndorraAngolaAntigua and BarbudaArab WorldArgentinaArmeniaAustraliaAustriaAzerbaijanBahamas, TheBahrainBangladeshBarbadosBelarusBelgiumBelizeBeninBermudaBhutanBoliviaBosnia and HerzegovinaBotswanaBrazilBrunei DarussalamBulgariaBurkina FasoBurundiCabo VerdeCambodiaCameroonCanadaCaribbean small statesCentral African RepublicCentral Europe and the BalticsChadChileChinaColombiaComorosCongo, Dem. Rep.Congo, Rep.Costa RicaCote d'IvoireCroatiaCubaCyprusCzech RepublicDenmarkDjiboutiDominicaDominican RepublicEarly-demographic dividendEast Asia & PacificEast Asia & Pacific (excluding high income)East Asia & Pacific (IDA & IBRD countries)EcuadorEgypt, Arab Rep.El SalvadorEquatorial GuineaEritreaEstoniaEthiopiaEuro areaEurope & Central AsiaEurope & Central Asia (excluding high income)Europe & Central Asia (IDA & IBRD countries)European UnionFaroe IslandsFijiFinlandFragile and conflict affected situationsFranceFrench PolynesiaGabonGambia, TheGeorgiaGermanyGhanaGreeceGreenlandGrenadaGuatemalaGuineaGuinea-BissauGuyanaHaitiHeavily indebted poor countries (HIPC)High incomeHondurasHong Kong SAR, ChinaHungaryIBRD onlyIcelandIDA & IBRD totalIDA blendIDA onlyIDA totalIndiaIndonesiaIran, Islamic Rep.IraqIrelandIsraelItalyJamaicaJapanJordanKazakhstanKenyaKiribatiKorea, Rep.KuwaitKyrgyz RepublicLao PDRLate-demographic dividendLatin America & Caribbean Latin America & Caribbean (excluding high income)Latin America & the Caribbean (IDA & IBRD countries)LatviaLeast developed countries: UN classificationLebanonLesothoLiberiaLibyaLiechtensteinLithuaniaLow & middle incomeLow incomeLower middle incomeLuxembourgMacao SAR, ChinaMacedonia, FYRMadagascarMalawiMalaysiaMaldivesMaliMaltaMarshall IslandsMauritaniaMauritiusMexicoMicronesia, Fed. Sts.Middle East & North AfricaMiddle East & North Africa (excluding high income)Middle East & North Africa (IDA & IBRD countries)Middle incomeMoldovaMongoliaMontenegroMoroccoMozambiqueNamibiaNepalNetherlandsNew CaledoniaNew ZealandNicaraguaNigerNigeriaNorth AmericaNorwayOECD membersOmanOther small statesPacific island small statesPakistanPalauPanamaPapua New GuineaParaguayPeruPhilippinesPolandPortugalPost-demographic dividendPre-demographic dividendQatarRomaniaRussian FederationRwandaSamoaSao Tome and PrincipeSaudi ArabiaSenegalSerbiaSeychellesSierra LeoneSingaporeSlovak RepublicSloveniaSmall statesSolomon IslandsSouth AfricaSouth AsiaSouth Asia (IDA & IBRD)SpainSri LankaSt. Kitts and NevisSt. LuciaSt. Vincent and the GrenadinesSub-Saharan Africa Sub-Saharan Africa (excluding high income)Sub-Saharan Africa (IDA & IBRD countries)SudanSurinameSwazilandSwedenSwitzerlandSyrian Arab RepublicTajikistanTanzaniaThailandTimor-LesteTogoTongaTrinidad and TobagoTunisiaTurkeyTurkmenistanUgandaUkraineUnited Arab EmiratesUnited KingdomUnited StatesUpper middle incomeUruguayUzbekistanVanuatuVenezuela, RBVietnamWest Bank and GazaWorldYemen, Rep.ZambiaZimbabwe Linea del tempo:
Questa scala temporale mostra un grafico dal 1971 anno al 2015 anno. Middle East & North Africa (IDA & IBRD countries). I dati fino ad 1970 anno non disponibili. Il numero di osservazioni attuali secondo i date: 45.
La fonte (nome):
Indicatori dello sviluppo mondiale
La fonte (organizzazione):
World Bank staff estimates based on Samuel Fankhauser's "Valuing Climate Change: The Economics of the Greenhouse" (1995).
Categorie:
Economy & Growth, Environment
sono stati aggiornati
23 apr 2017 anni
Indicatori delle variazioni dei valori per anni
Minima:
0.367
1 gen 1981 anni
Massimo:
1.426
1 gen 2003 anni
Alla data di osservazione
Valore
Variazione assoluta
La variazione rispetto al valore precedente
1 gen 1971 anni
0.629
+0.629
0.0%
1 gen 1972 anni
0.653
+0.025
3.94%
1 gen 1973 anni
0.624
-0.029
-4.47%
1 gen 1974 anni
0.591
-0.033
-5.31%
1 gen 1975 anni
0.465
-0.126
-21.31%
1 gen 1976 anni
0.45
-0.015
-3.18%
1 gen 1977 anni
0.45
-0.001
-0.16%
1 gen 1978 anni
0.446
-0.003
-0.77%
1 gen 1979 anni
0.5
+0.053
11.97%
1 gen 1980 anni
0.449
-0.051
-10.19%
1 gen 1981 anni
0.367
-0.081
-18.14%
1 gen 1982 anni
0.385
+0.018
4.85%
1 gen 1983 anni
0.392
+0.007
1.92%
1 gen 1984 anni
0.417
+0.025
6.32%
1 gen 1985 anni
0.452
+0.035
8.36%
1 gen 1986 anni
0.454
+0.002
0.47%
1 gen 1987 anni
0.432
-0.023
-4.99%
1 gen 1988 anni
0.558
+0.126
29.27%
1 gen 1989 anni
0.66
+0.102
18.25%
1 gen 1990 anni
0.719
+0.059
9.01%
1 gen 1991 anni
0.549
-0.17
-23.63%
1 gen 1992 anni
0.936
+0.387
70.38%
1 gen 1993 anni
0.932
-0.003
-0.35%
1 gen 1994 anni
1.274
+0.342
36.66%
1 gen 1995 anni
1.34
+0.066
5.18%
1 gen 1996 anni
1.225
-0.116
-8.63%
1 gen 1997 anni
1.123
-0.101
-8.25%
1 gen 1998 anni
1.111
-0.013
-1.13%
1 gen 1999 anni
1.247
+0.136
12.27%
1 gen 2000 anni
1.365
+0.118
9.46%
1 gen 2001 anni
1.371
+0.006
0.4%
1 gen 2002 anni
1.367
-0.004
-0.29%
1 gen 2003 anni
1.426
+0.059
4.33%
1 gen 2004 anni
1.406
-0.02
-1.37%
1 gen 2005 anni
1.395
-0.011
-0.81%
1 gen 2006 anni
1.306
-0.089
-6.39%
1 gen 2007 anni
1.203
-0.103
-7.87%
1 gen 2008 anni
1.013
-0.19
-15.82%
1 gen 2009 anni
0.879
-0.133
-13.18%
1 gen 2010 anni
0.973
+0.094
10.67%
1 gen 2011 anni
0.895
-0.078
-8.03%
1 gen 2012 anni
0.818
-0.077
-8.61%
1 gen 2013 anni
0.785
-0.033
-3.98%
1 gen 2014 anni
0.833
+0.048
6.13%
1 gen 2015 anni
0.725
-0.109
-13.04%
Classificazione dei paesi secondo i statistiche attuali per anni


Commenti: