29
/it/
it
AIzaSyAYiBZKx7MnpbEhh9jyipgxe19OcubqV5w
April 1, 2024
39676
IDA total
IDA
false
2
1
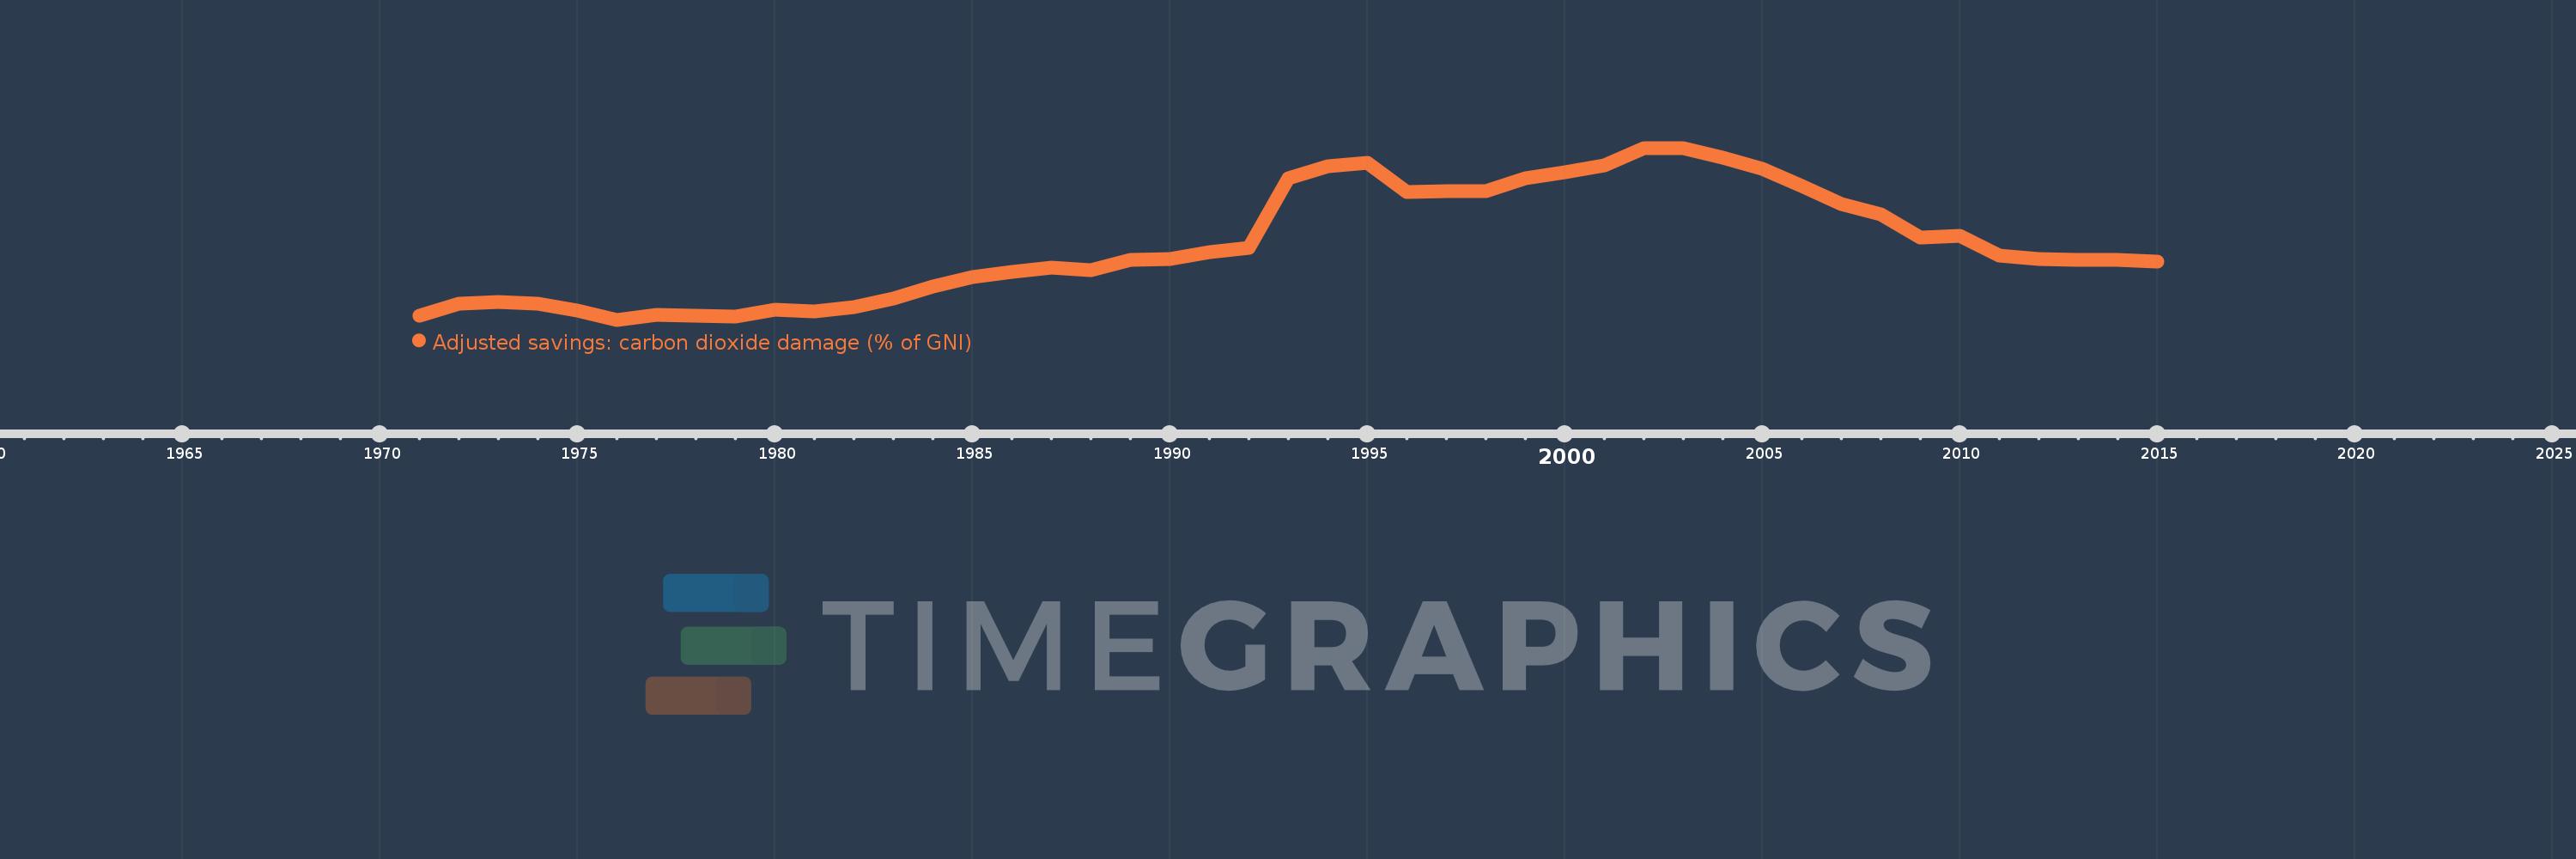
Adjusted savings: carbon dioxide damage (% of GNI)
2015,2014,2013,2012,2011,2010,2009,2008,2007,2006,2005,2004,2003,2002,2001,2000,1999,1998,1997,1996,1995,1994,1993,1992,1991,1990,1989,1988,1987,1986,1985,1984,1983,1982,1981,1980,1979,1978,1977,1976,1975,1974,1973,1972,1971
Queste statistiche in altri paesi:
AfghanistanAlbaniaAlgeriaAndorraAngolaAntigua and BarbudaArab WorldArgentinaArmeniaAustraliaAustriaAzerbaijanBahamas, TheBahrainBangladeshBarbadosBelarusBelgiumBelizeBeninBermudaBhutanBoliviaBosnia and HerzegovinaBotswanaBrazilBrunei DarussalamBulgariaBurkina FasoBurundiCabo VerdeCambodiaCameroonCanadaCaribbean small statesCentral African RepublicCentral Europe and the BalticsChadChileChinaColombiaComorosCongo, Dem. Rep.Congo, Rep.Costa RicaCote d'IvoireCroatiaCubaCyprusCzech RepublicDenmarkDjiboutiDominicaDominican RepublicEarly-demographic dividendEast Asia & PacificEast Asia & Pacific (excluding high income)East Asia & Pacific (IDA & IBRD countries)EcuadorEgypt, Arab Rep.El SalvadorEquatorial GuineaEritreaEstoniaEthiopiaEuro areaEurope & Central AsiaEurope & Central Asia (excluding high income)Europe & Central Asia (IDA & IBRD countries)European UnionFaroe IslandsFijiFinlandFragile and conflict affected situationsFranceFrench PolynesiaGabonGambia, TheGeorgiaGermanyGhanaGreeceGreenlandGrenadaGuatemalaGuineaGuinea-BissauGuyanaHaitiHeavily indebted poor countries (HIPC)High incomeHondurasHong Kong SAR, ChinaHungaryIBRD onlyIcelandIDA & IBRD totalIDA blendIDA onlyIDA totalIndiaIndonesiaIran, Islamic Rep.IraqIrelandIsraelItalyJamaicaJapanJordanKazakhstanKenyaKiribatiKorea, Rep.KuwaitKyrgyz RepublicLao PDRLate-demographic dividendLatin America & Caribbean Latin America & Caribbean (excluding high income)Latin America & the Caribbean (IDA & IBRD countries)LatviaLeast developed countries: UN classificationLebanonLesothoLiberiaLibyaLiechtensteinLithuaniaLow & middle incomeLow incomeLower middle incomeLuxembourgMacao SAR, ChinaMacedonia, FYRMadagascarMalawiMalaysiaMaldivesMaliMaltaMarshall IslandsMauritaniaMauritiusMexicoMicronesia, Fed. Sts.Middle East & North AfricaMiddle East & North Africa (excluding high income)Middle East & North Africa (IDA & IBRD countries)Middle incomeMoldovaMongoliaMontenegroMoroccoMozambiqueNamibiaNepalNetherlandsNew CaledoniaNew ZealandNicaraguaNigerNigeriaNorth AmericaNorwayOECD membersOmanOther small statesPacific island small statesPakistanPalauPanamaPapua New GuineaParaguayPeruPhilippinesPolandPortugalPost-demographic dividendPre-demographic dividendQatarRomaniaRussian FederationRwandaSamoaSao Tome and PrincipeSaudi ArabiaSenegalSerbiaSeychellesSierra LeoneSingaporeSlovak RepublicSloveniaSmall statesSolomon IslandsSouth AfricaSouth AsiaSouth Asia (IDA & IBRD)SpainSri LankaSt. Kitts and NevisSt. LuciaSt. Vincent and the GrenadinesSub-Saharan Africa Sub-Saharan Africa (excluding high income)Sub-Saharan Africa (IDA & IBRD countries)SudanSurinameSwazilandSwedenSwitzerlandSyrian Arab RepublicTajikistanTanzaniaThailandTimor-LesteTogoTongaTrinidad and TobagoTunisiaTurkeyTurkmenistanUgandaUkraineUnited Arab EmiratesUnited KingdomUnited StatesUpper middle incomeUruguayUzbekistanVanuatuVenezuela, RBVietnamWest Bank and GazaWorldYemen, Rep.ZambiaZimbabwe Linea del tempo:
Questa scala temporale mostra un grafico dal 1971 anno al 2015 anno. IDA total. I dati fino ad 1970 anno non disponibili. Il numero di osservazioni attuali secondo i date: 45.
La fonte (nome):
Indicatori dello sviluppo mondiale
La fonte (organizzazione):
World Bank staff estimates based on Samuel Fankhauser's "Valuing Climate Change: The Economics of the Greenhouse" (1995).
Categorie:
Economy & Growth, Environment
sono stati aggiornati
23 apr 2017 anni
Indicatori delle variazioni dei valori per anni
Minima:
0.236
1 gen 1976 anni
Massimo:
0.99
1 gen 2003 anni
Alla data di osservazione
Valore
Variazione assoluta
La variazione rispetto al valore precedente
1 gen 1971 anni
0.254
+0.254
0.0%
1 gen 1972 anni
0.307
+0.052
20.57%
1 gen 1973 anni
0.315
+0.009
2.77%
1 gen 1974 anni
0.306
-0.009
-2.89%
1 gen 1975 anni
0.277
-0.029
-9.51%
1 gen 1976 anni
0.236
-0.041
-14.82%
1 gen 1977 anni
0.258
+0.022
9.47%
1 gen 1978 anni
0.254
-0.004
-1.65%
1 gen 1979 anni
0.249
-0.004
-1.76%
1 gen 1980 anni
0.281
+0.031
12.44%
1 gen 1981 anni
0.271
-0.009
-3.35%
1 gen 1982 anni
0.292
+0.021
7.69%
1 gen 1983 anni
0.329
+0.037
12.66%
1 gen 1984 anni
0.381
+0.052
15.81%
1 gen 1985 anni
0.425
+0.044
11.62%
1 gen 1986 anni
0.446
+0.02
4.82%
1 gen 1987 anni
0.464
+0.018
4.04%
1 gen 1988 anni
0.454
-0.01
-2.08%
1 gen 1989 anni
0.5
+0.046
10.16%
1 gen 1990 anni
0.504
+0.004
0.72%
1 gen 1991 anni
0.532
+0.028
5.62%
1 gen 1992 anni
0.553
+0.021
3.94%
1 gen 1993 anni
0.858
+0.305
55.23%
1 gen 1994 anni
0.911
+0.052
6.07%
1 gen 1995 anni
0.924
+0.014
1.49%
1 gen 1996 anni
0.796
-0.128
-13.87%
1 gen 1997 anni
0.801
+0.005
0.66%
1 gen 1998 anni
0.8
-0.001
-0.14%
1 gen 1999 anni
0.858
+0.058
7.22%
1 gen 2000 anni
0.883
+0.025
2.9%
1 gen 2001 anni
0.912
+0.03
3.36%
1 gen 2002 anni
0.988
+0.075
8.26%
1 gen 2003 anni
0.99
+0.002
0.25%
1 gen 2004 anni
0.947
-0.043
-4.34%
1 gen 2005 anni
0.897
-0.05
-5.32%
1 gen 2006 anni
0.824
-0.073
-8.1%
1 gen 2007 anni
0.744
-0.081
-9.77%
1 gen 2008 anni
0.7
-0.043
-5.82%
1 gen 2009 anni
0.595
-0.106
-15.08%
1 gen 2010 anni
0.604
+0.009
1.59%
1 gen 2011 anni
0.516
-0.088
-14.53%
1 gen 2012 anni
0.501
-0.015
-2.99%
1 gen 2013 anni
0.498
-0.003
-0.53%
1 gen 2014 anni
0.498
+0.0
0.02%
1 gen 2015 anni
0.493
-0.006
-1.15%
Classificazione dei paesi secondo i statistiche attuali per anni


Commenti: