29
/it/
it
AIzaSyAYiBZKx7MnpbEhh9jyipgxe19OcubqV5w
April 1, 2024
90398
Botswana
BWA
true
2
1
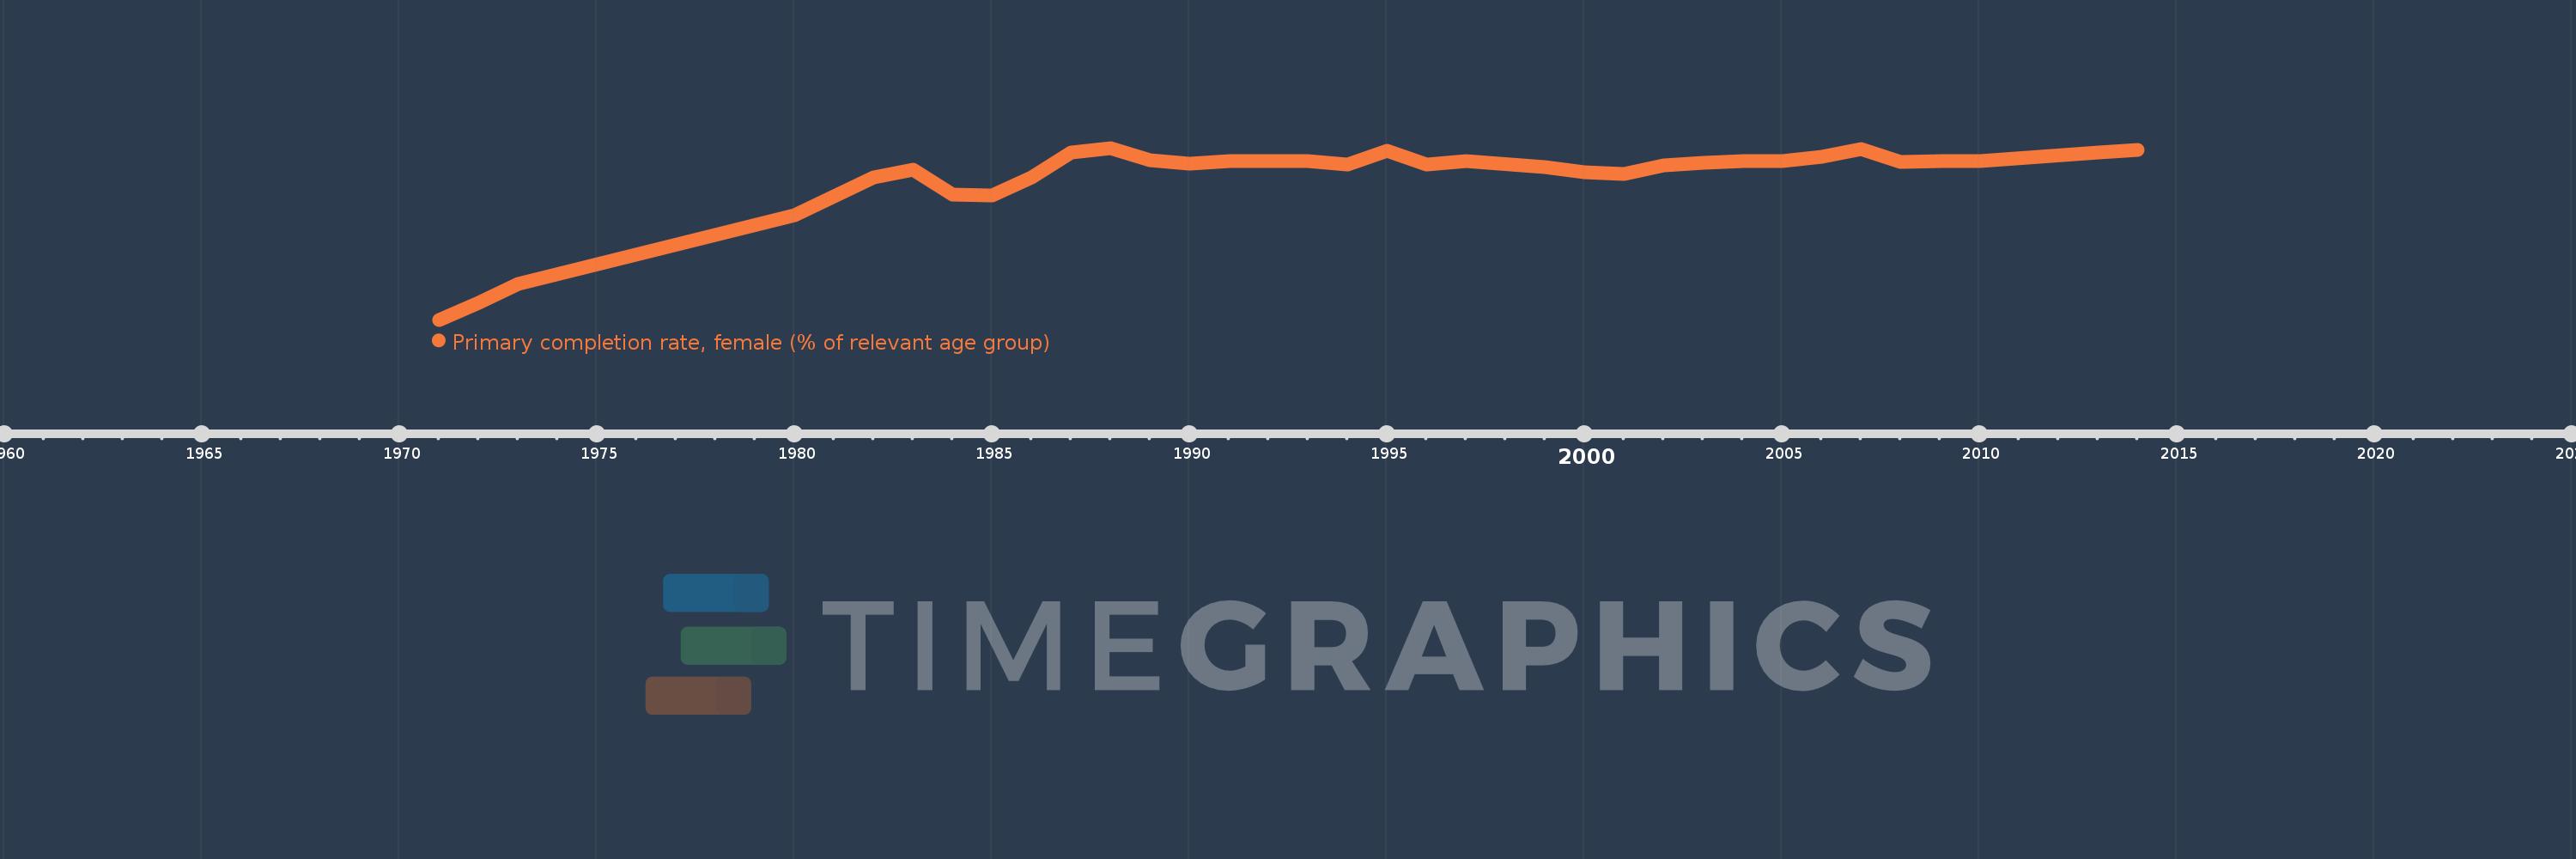
Primary completion rate, female (% of relevant age group)
2014,2013,2010,2009,2008,2007,2006,2005,2004,2003,2002,2001,2000,1999,1997,1996,1995,1994,1993,1992,1991,1990,1989,1988,1987,1986,1985,1984,1983,1982,1980,1973,1972,1971
Queste statistiche in altri paesi:
AfghanistanAlbaniaAlgeriaAngolaAntigua and BarbudaArab WorldArgentinaArmeniaArubaAustriaAzerbaijanBahamas, TheBahrainBangladeshBarbadosBelarusBelgiumBelizeBeninBermudaBhutanBoliviaBosnia and HerzegovinaBotswanaBrunei DarussalamBulgariaBurkina FasoBurundiCabo VerdeCambodiaCameroonCanadaCaribbean small statesCentral African RepublicCentral Europe and the BalticsChadChileChinaColombiaComorosCongo, Dem. Rep.Congo, Rep.Costa RicaCote d'IvoireCroatiaCubaCyprusCzech RepublicDenmarkDjiboutiDominicaDominican RepublicEarly-demographic dividendEast Asia & PacificEast Asia & Pacific (excluding high income)East Asia & Pacific (IDA & IBRD countries)EcuadorEgypt, Arab Rep.El SalvadorEquatorial GuineaEritreaEstoniaEthiopiaEuro areaEurope & Central AsiaEurope & Central Asia (excluding high income)Europe & Central Asia (IDA & IBRD countries)European UnionFijiFinlandFragile and conflict affected situationsFranceGabonGambia, TheGeorgiaGermanyGhanaGreeceGrenadaGuatemalaGuineaGuinea-BissauGuyanaHaitiHeavily indebted poor countries (HIPC)High incomeHondurasHong Kong SAR, ChinaHungaryIBRD onlyIcelandIDA & IBRD totalIDA blendIDA onlyIDA totalIndiaIndonesiaIran, Islamic Rep.IraqIrelandIsraelItalyJamaicaJapanJordanKazakhstanKenyaKiribatiKorea, Dem. People’s Rep.Korea, Rep.KuwaitKyrgyz RepublicLao PDRLate-demographic dividendLatin America & Caribbean Latin America & Caribbean (excluding high income)Latin America & the Caribbean (IDA & IBRD countries)LatviaLeast developed countries: UN classificationLebanonLesothoLiberiaLibyaLiechtensteinLithuaniaLow & middle incomeLow incomeLower middle incomeLuxembourgMacao SAR, ChinaMacedonia, FYRMadagascarMalawiMaldivesMaliMaltaMarshall IslandsMauritaniaMauritiusMexicoMiddle East & North AfricaMiddle East & North Africa (excluding high income)Middle East & North Africa (IDA & IBRD countries)Middle incomeMoldovaMongoliaMontenegroMoroccoMozambiqueMyanmarNamibiaNauruNepalNetherlandsNew ZealandNicaraguaNigerNigeriaNorwayOECD membersOmanOther small statesPacific island small statesPakistanPalauPanamaPapua New GuineaParaguayPeruPhilippinesPolandPortugalPost-demographic dividendPre-demographic dividendQatarRomaniaRussian FederationRwandaSamoaSan MarinoSao Tome and PrincipeSaudi ArabiaSenegalSerbiaSeychellesSierra LeoneSlovak RepublicSloveniaSmall statesSolomon IslandsSouth AfricaSouth AsiaSouth Asia (IDA & IBRD)South SudanSpainSri LankaSt. Kitts and NevisSt. LuciaSt. Vincent and the GrenadinesSub-Saharan Africa Sub-Saharan Africa (excluding high income)Sub-Saharan Africa (IDA & IBRD countries)SudanSurinameSwazilandSwedenSwitzerlandSyrian Arab RepublicTajikistanTanzaniaThailandTimor-LesteTogoTongaTrinidad and TobagoTunisiaTurkeyTuvaluUgandaUkraineUnited Arab EmiratesUpper middle incomeUruguayUzbekistanVanuatuVenezuela, RBVietnamWest Bank and GazaWorldYemen, Rep.ZambiaZimbabwe Linea del tempo:
Questa scala temporale mostra un grafico dal 1971 anno al 2014 anno. Botswana. I dati fino ad 1970 anno non disponibili. Il numero di osservazioni attuali secondo i date: 34.
La fonte (nome):
Indicatori dello sviluppo mondiale
La fonte (organizzazione):
United Nations Educational, Scientific, and Cultural Organization (UNESCO) Institute for Statistics.
Categorie:
Education, Gender
sono stati aggiornati
23 apr 2017 anni
Indicatori delle variazioni dei valori per anni
Minima:
38.169
1 gen 1971 anni
Massimo:
101.926
1 gen 1988 anni
Alla data di osservazione
Valore
Variazione assoluta
La variazione rispetto al valore precedente
1 gen 1971 anni
38.169
+38.169
0.0%
1 gen 1972 anni
44.472
+6.303
16.51%
1 gen 1973 anni
51.502
+7.03
15.81%
1 gen 1980 anni
76.942
+25.44
49.4%
1 gen 1982 anni
90.835
+13.892
18.06%
1 gen 1983 anni
93.75
+2.915
3.21%
1 gen 1984 anni
84.659
-9.091
-9.7%
1 gen 1985 anni
84.421
-0.238
-0.28%
1 gen 1986 anni
91.06
+6.639
7.86%
1 gen 1987 anni
100.222
+9.163
10.06%
1 gen 1988 anni
101.926
+1.704
1.7%
1 gen 1989 anni
97.354
-4.572
-4.49%
1 gen 1990 anni
96.075
-1.278
-1.31%
1 gen 1991 anni
97.18
+1.105
1.15%
1 gen 1992 anni
97.102
-0.079
-0.08%
1 gen 1993 anni
96.992
-0.11
-0.11%
1 gen 1994 anni
95.638
-1.354
-1.4%
1 gen 1995 anni
100.96
+5.322
5.56%
1 gen 1996 anni
95.879
-5.081
-5.03%
1 gen 1997 anni
96.926
+1.046
1.09%
1 gen 1999 anni
94.928
-1.998
-2.06%
1 gen 2000 anni
92.902
-2.026
-2.13%
1 gen 2001 anni
92.128
-0.774
-0.83%
1 gen 2002 anni
95.383
+3.255
3.53%
1 gen 2003 anni
96.395
+1.011
1.06%
1 gen 2004 anni
96.964
+0.569
0.59%
1 gen 2005 anni
97.089
+0.125
0.13%
1 gen 2006 anni
98.67
+1.581
1.63%
1 gen 2007 anni
101.669
+3.0
3.04%
1 gen 2008 anni
96.715
-4.954
-4.87%
1 gen 2009 anni
97.166
+0.451
0.47%
1 gen 2010 anni
97.118
-0.048
-0.05%
1 gen 2013 anni
100.317
+3.2
3.29%
1 gen 2014 anni
101.228
+0.911
0.91%
Classificazione dei paesi secondo i statistiche attuali per anni


Commenti: