29
/it/
it
AIzaSyAYiBZKx7MnpbEhh9jyipgxe19OcubqV5w
April 1, 2024
26838
Early-demographic dividend
EAR
false
2
1
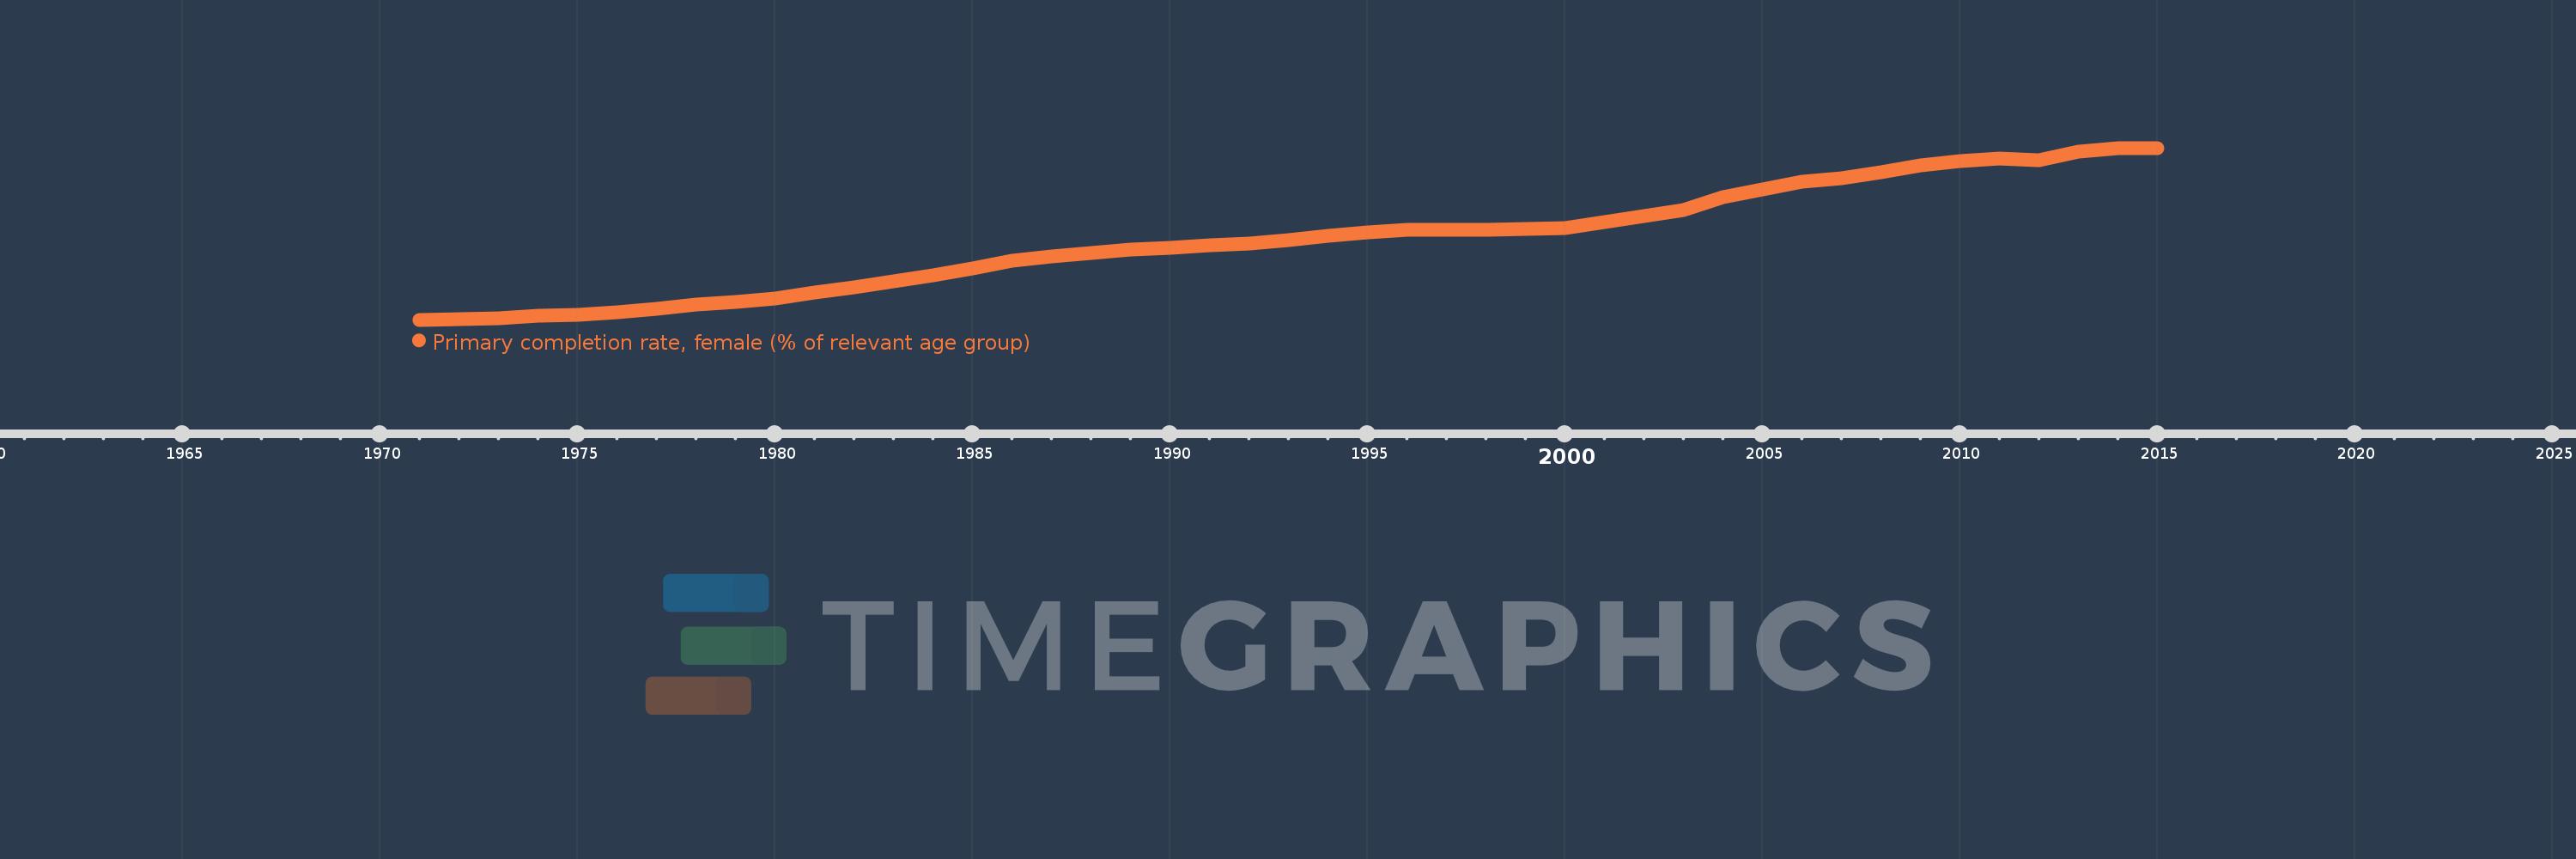
Primary completion rate, female (% of relevant age group)
2015,2014,2013,2012,2011,2010,2009,2008,2007,2006,2005,2004,2003,2002,2001,2000,1999,1998,1997,1996,1995,1994,1993,1992,1991,1990,1989,1988,1987,1986,1985,1984,1983,1982,1981,1980,1979,1978,1977,1976,1975,1974,1973,1972,1971
Queste statistiche in altri paesi:
AfghanistanAlbaniaAlgeriaAngolaAntigua and BarbudaArab WorldArgentinaArmeniaArubaAustriaAzerbaijanBahamas, TheBahrainBangladeshBarbadosBelarusBelgiumBelizeBeninBermudaBhutanBoliviaBosnia and HerzegovinaBotswanaBrunei DarussalamBulgariaBurkina FasoBurundiCabo VerdeCambodiaCameroonCanadaCaribbean small statesCentral African RepublicCentral Europe and the BalticsChadChileChinaColombiaComorosCongo, Dem. Rep.Congo, Rep.Costa RicaCote d'IvoireCroatiaCubaCyprusCzech RepublicDenmarkDjiboutiDominicaDominican RepublicEarly-demographic dividendEast Asia & PacificEast Asia & Pacific (excluding high income)East Asia & Pacific (IDA & IBRD countries)EcuadorEgypt, Arab Rep.El SalvadorEquatorial GuineaEritreaEstoniaEthiopiaEuro areaEurope & Central AsiaEurope & Central Asia (excluding high income)Europe & Central Asia (IDA & IBRD countries)European UnionFijiFinlandFragile and conflict affected situationsFranceGabonGambia, TheGeorgiaGermanyGhanaGreeceGrenadaGuatemalaGuineaGuinea-BissauGuyanaHaitiHeavily indebted poor countries (HIPC)High incomeHondurasHong Kong SAR, ChinaHungaryIBRD onlyIcelandIDA & IBRD totalIDA blendIDA onlyIDA totalIndiaIndonesiaIran, Islamic Rep.IraqIrelandIsraelItalyJamaicaJapanJordanKazakhstanKenyaKiribatiKorea, Dem. People’s Rep.Korea, Rep.KuwaitKyrgyz RepublicLao PDRLate-demographic dividendLatin America & Caribbean Latin America & Caribbean (excluding high income)Latin America & the Caribbean (IDA & IBRD countries)LatviaLeast developed countries: UN classificationLebanonLesothoLiberiaLibyaLiechtensteinLithuaniaLow & middle incomeLow incomeLower middle incomeLuxembourgMacao SAR, ChinaMacedonia, FYRMadagascarMalawiMaldivesMaliMaltaMarshall IslandsMauritaniaMauritiusMexicoMiddle East & North AfricaMiddle East & North Africa (excluding high income)Middle East & North Africa (IDA & IBRD countries)Middle incomeMoldovaMongoliaMontenegroMoroccoMozambiqueMyanmarNamibiaNauruNepalNetherlandsNew ZealandNicaraguaNigerNigeriaNorwayOECD membersOmanOther small statesPacific island small statesPakistanPalauPanamaPapua New GuineaParaguayPeruPhilippinesPolandPortugalPost-demographic dividendPre-demographic dividendQatarRomaniaRussian FederationRwandaSamoaSan MarinoSao Tome and PrincipeSaudi ArabiaSenegalSerbiaSeychellesSierra LeoneSlovak RepublicSloveniaSmall statesSolomon IslandsSouth AfricaSouth AsiaSouth Asia (IDA & IBRD)South SudanSpainSri LankaSt. Kitts and NevisSt. LuciaSt. Vincent and the GrenadinesSub-Saharan Africa Sub-Saharan Africa (excluding high income)Sub-Saharan Africa (IDA & IBRD countries)SudanSurinameSwazilandSwedenSwitzerlandSyrian Arab RepublicTajikistanTanzaniaThailandTimor-LesteTogoTongaTrinidad and TobagoTunisiaTurkeyTuvaluUgandaUkraineUnited Arab EmiratesUpper middle incomeUruguayUzbekistanVanuatuVenezuela, RBVietnamWest Bank and GazaWorldYemen, Rep.ZambiaZimbabwe Linea del tempo:
Questa scala temporale mostra un grafico dal 1971 anno al 2015 anno. Early-demographic dividend. I dati fino ad 1970 anno non disponibili. Il numero di osservazioni attuali secondo i date: 45.
La fonte (nome):
Indicatori dello sviluppo mondiale
La fonte (organizzazione):
United Nations Educational, Scientific, and Cultural Organization (UNESCO) Institute for Statistics.
Categorie:
Education, Gender
sono stati aggiornati
23 apr 2017 anni
Indicatori delle variazioni dei valori per anni
Minima:
41.406
1 gen 1971 anni
Massimo:
93.44
1 gen 2015 anni
Alla data di osservazione
Valore
Variazione assoluta
La variazione rispetto al valore precedente
1 gen 1971 anni
41.406
+41.406
0.0%
1 gen 1972 anni
41.475
+0.069
0.17%
1 gen 1973 anni
41.776
+0.301
0.73%
1 gen 1974 anni
42.546
+0.769
1.84%
1 gen 1975 anni
42.828
+0.282
0.66%
1 gen 1976 anni
43.694
+0.866
2.02%
1 gen 1977 anni
44.701
+1.007
2.3%
1 gen 1978 anni
45.942
+1.241
2.78%
1 gen 1979 anni
46.81
+0.869
1.89%
1 gen 1980 anni
47.807
+0.996
2.13%
1 gen 1981 anni
49.577
+1.77
3.7%
1 gen 1982 anni
51.199
+1.622
3.27%
1 gen 1983 anni
52.986
+1.787
3.49%
1 gen 1984 anni
54.793
+1.807
3.41%
1 gen 1985 anni
57.027
+2.234
4.08%
1 gen 1986 anni
59.197
+2.17
3.81%
1 gen 1987 anni
60.591
+1.394
2.35%
1 gen 1988 anni
61.493
+0.903
1.49%
1 gen 1989 anni
62.722
+1.228
2.0%
1 gen 1990 anni
63.269
+0.548
0.87%
1 gen 1991 anni
63.867
+0.598
0.94%
1 gen 1992 anni
64.537
+0.67
1.05%
1 gen 1993 anni
65.649
+1.112
1.72%
1 gen 1994 anni
66.768
+1.119
1.71%
1 gen 1995 anni
67.805
+1.037
1.55%
1 gen 1996 anni
68.753
+0.948
1.4%
1 gen 1997 anni
68.7
-0.053
-0.08%
1 gen 1998 anni
68.571
-0.129
-0.19%
1 gen 1999 anni
68.935
+0.364
0.53%
1 gen 2000 anni
69.161
+0.226
0.33%
1 gen 2001 anni
71.001
+1.841
2.66%
1 gen 2002 anni
72.726
+1.725
2.43%
1 gen 2003 anni
74.721
+1.995
2.74%
1 gen 2004 anni
78.53
+3.809
5.1%
1 gen 2005 anni
80.807
+2.277
2.9%
1 gen 2006 anni
83.094
+2.286
2.83%
1 gen 2007 anni
84.129
+1.035
1.25%
1 gen 2008 anni
86.154
+2.026
2.41%
1 gen 2009 anni
88.032
+1.878
2.18%
1 gen 2010 anni
89.471
+1.439
1.63%
1 gen 2011 anni
90.115
+0.644
0.72%
1 gen 2012 anni
89.819
-0.296
-0.33%
1 gen 2013 anni
92.308
+2.489
2.77%
1 gen 2014 anni
93.36
+1.052
1.14%
1 gen 2015 anni
93.44
+0.08
0.09%
Classificazione dei paesi secondo i statistiche attuali per anni


Commenti: