29
/it/
it
AIzaSyAYiBZKx7MnpbEhh9jyipgxe19OcubqV5w
April 1, 2024
40277
IDA total
IDA
false
2
1
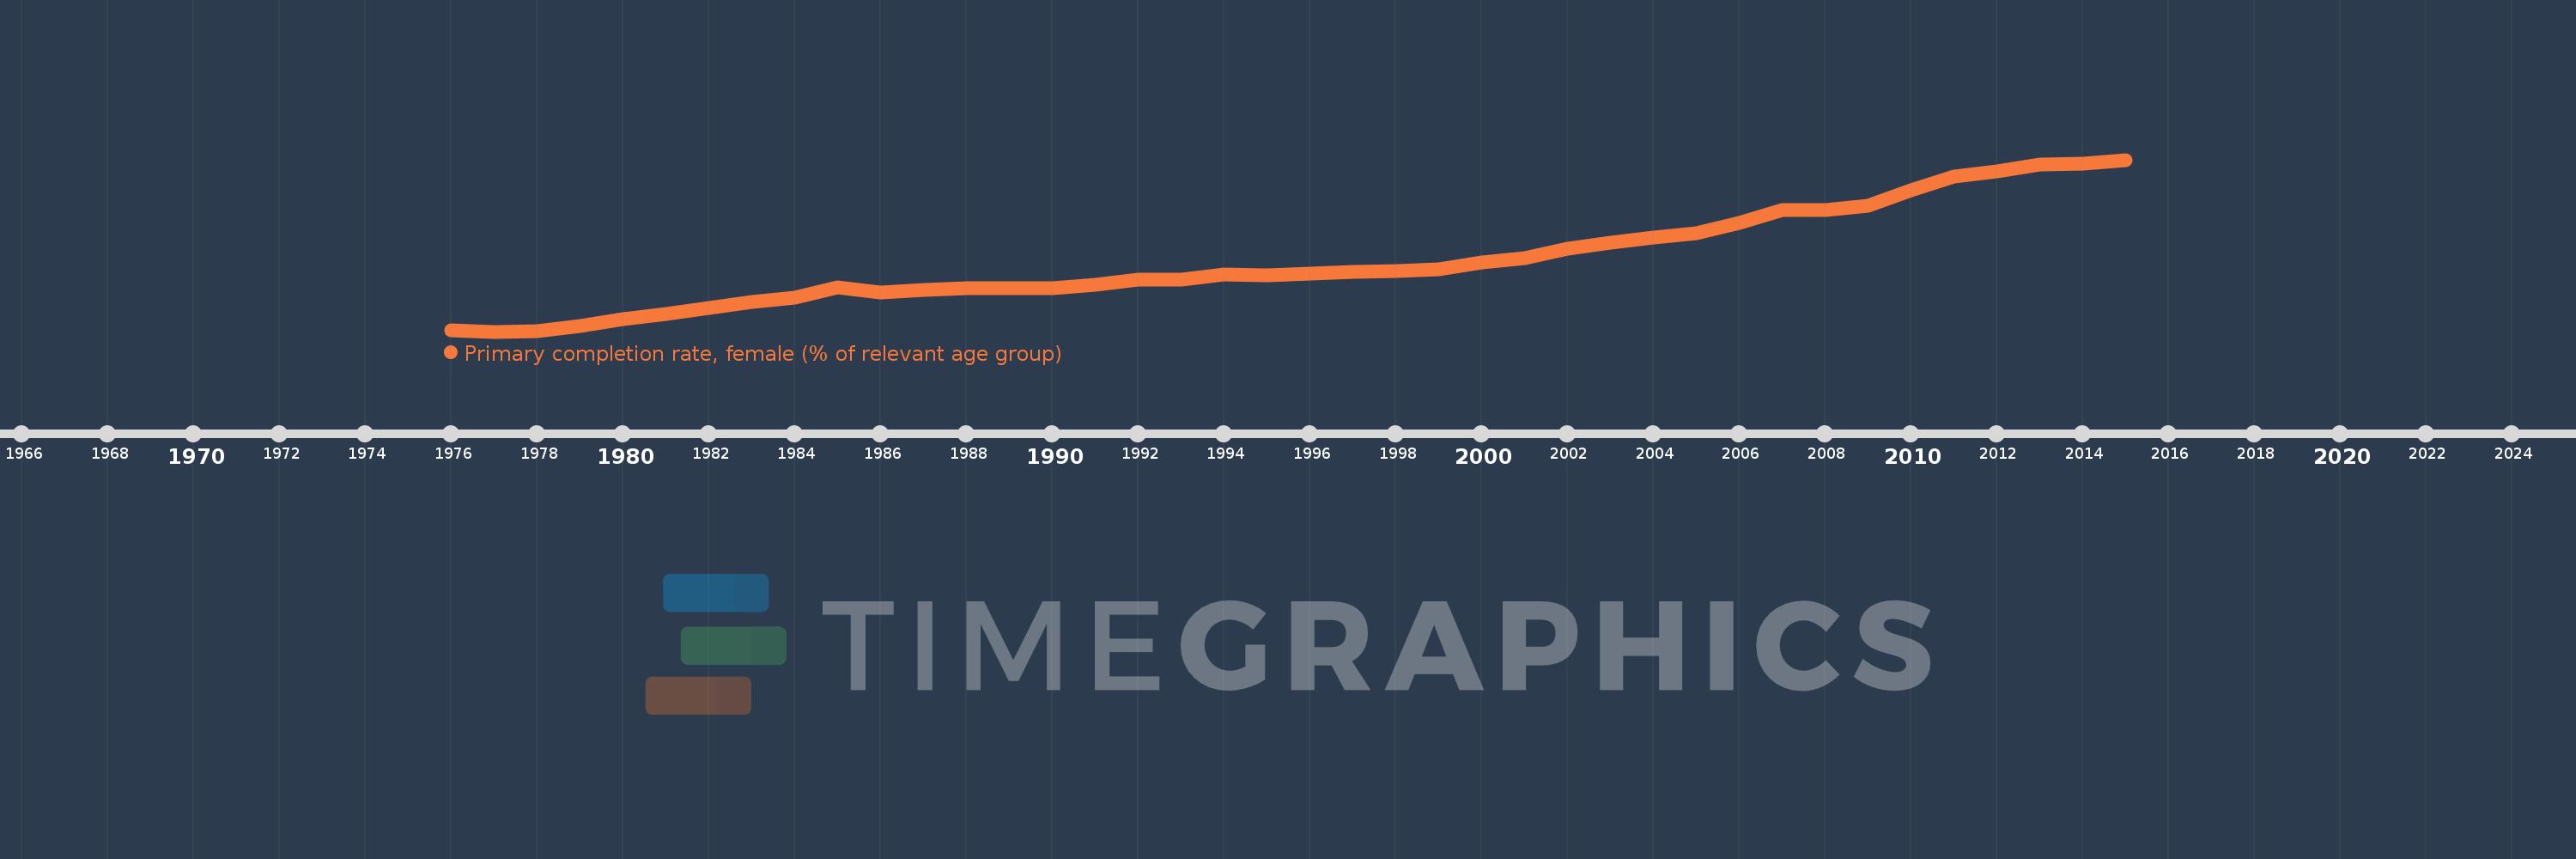
Primary completion rate, female (% of relevant age group)
2015,2014,2013,2012,2011,2010,2009,2008,2007,2006,2005,2004,2003,2002,2001,2000,1999,1998,1997,1996,1995,1994,1993,1992,1991,1990,1989,1988,1987,1986,1985,1984,1983,1982,1981,1980,1979,1978,1977,1976
Queste statistiche in altri paesi:
AfghanistanAlbaniaAlgeriaAngolaAntigua and BarbudaArab WorldArgentinaArmeniaArubaAustriaAzerbaijanBahamas, TheBahrainBangladeshBarbadosBelarusBelgiumBelizeBeninBermudaBhutanBoliviaBosnia and HerzegovinaBotswanaBrunei DarussalamBulgariaBurkina FasoBurundiCabo VerdeCambodiaCameroonCanadaCaribbean small statesCentral African RepublicCentral Europe and the BalticsChadChileChinaColombiaComorosCongo, Dem. Rep.Congo, Rep.Costa RicaCote d'IvoireCroatiaCubaCyprusCzech RepublicDenmarkDjiboutiDominicaDominican RepublicEarly-demographic dividendEast Asia & PacificEast Asia & Pacific (excluding high income)East Asia & Pacific (IDA & IBRD countries)EcuadorEgypt, Arab Rep.El SalvadorEquatorial GuineaEritreaEstoniaEthiopiaEuro areaEurope & Central AsiaEurope & Central Asia (excluding high income)Europe & Central Asia (IDA & IBRD countries)European UnionFijiFinlandFragile and conflict affected situationsFranceGabonGambia, TheGeorgiaGermanyGhanaGreeceGrenadaGuatemalaGuineaGuinea-BissauGuyanaHaitiHeavily indebted poor countries (HIPC)High incomeHondurasHong Kong SAR, ChinaHungaryIBRD onlyIcelandIDA & IBRD totalIDA blendIDA onlyIDA totalIndiaIndonesiaIran, Islamic Rep.IraqIrelandIsraelItalyJamaicaJapanJordanKazakhstanKenyaKiribatiKorea, Dem. People’s Rep.Korea, Rep.KuwaitKyrgyz RepublicLao PDRLate-demographic dividendLatin America & Caribbean Latin America & Caribbean (excluding high income)Latin America & the Caribbean (IDA & IBRD countries)LatviaLeast developed countries: UN classificationLebanonLesothoLiberiaLibyaLiechtensteinLithuaniaLow & middle incomeLow incomeLower middle incomeLuxembourgMacao SAR, ChinaMacedonia, FYRMadagascarMalawiMaldivesMaliMaltaMarshall IslandsMauritaniaMauritiusMexicoMiddle East & North AfricaMiddle East & North Africa (excluding high income)Middle East & North Africa (IDA & IBRD countries)Middle incomeMoldovaMongoliaMontenegroMoroccoMozambiqueMyanmarNamibiaNauruNepalNetherlandsNew ZealandNicaraguaNigerNigeriaNorwayOECD membersOmanOther small statesPacific island small statesPakistanPalauPanamaPapua New GuineaParaguayPeruPhilippinesPolandPortugalPost-demographic dividendPre-demographic dividendQatarRomaniaRussian FederationRwandaSamoaSan MarinoSao Tome and PrincipeSaudi ArabiaSenegalSerbiaSeychellesSierra LeoneSlovak RepublicSloveniaSmall statesSolomon IslandsSouth AfricaSouth AsiaSouth Asia (IDA & IBRD)South SudanSpainSri LankaSt. Kitts and NevisSt. LuciaSt. Vincent and the GrenadinesSub-Saharan Africa Sub-Saharan Africa (excluding high income)Sub-Saharan Africa (IDA & IBRD countries)SudanSurinameSwazilandSwedenSwitzerlandSyrian Arab RepublicTajikistanTanzaniaThailandTimor-LesteTogoTongaTrinidad and TobagoTunisiaTurkeyTuvaluUgandaUkraineUnited Arab EmiratesUpper middle incomeUruguayUzbekistanVanuatuVenezuela, RBVietnamWest Bank and GazaWorldYemen, Rep.ZambiaZimbabwe Linea del tempo:
Questa scala temporale mostra un grafico dal 1976 anno al 2015 anno. IDA total. I dati fino ad 1975 anno non disponibili. Il numero di osservazioni attuali secondo i date: 40.
La fonte (nome):
Indicatori dello sviluppo mondiale
La fonte (organizzazione):
United Nations Educational, Scientific, and Cultural Organization (UNESCO) Institute for Statistics.
Categorie:
Education, Gender
sono stati aggiornati
23 apr 2017 anni
Indicatori delle variazioni dei valori per anni
Minima:
43.804
1 gen 1977 anni
Massimo:
71.675
1 gen 2015 anni
Alla data di osservazione
Valore
Variazione assoluta
La variazione rispetto al valore precedente
1 gen 1976 anni
44.047
+44.047
0.0%
1 gen 1977 anni
43.804
-0.243
-0.55%
1 gen 1978 anni
43.896
+0.092
0.21%
1 gen 1979 anni
44.757
+0.861
1.96%
1 gen 1980 anni
45.83
+1.073
2.4%
1 gen 1981 anni
46.592
+0.762
1.66%
1 gen 1982 anni
47.595
+1.003
2.15%
1 gen 1983 anni
48.581
+0.986
2.07%
1 gen 1984 anni
49.37
+0.789
1.62%
1 gen 1985 anni
50.914
+1.544
3.13%
1 gen 1986 anni
50.194
-0.72
-1.41%
1 gen 1987 anni
50.573
+0.379
0.76%
1 gen 1988 anni
50.852
+0.28
0.55%
1 gen 1989 anni
50.873
+0.02
0.04%
1 gen 1990 anni
50.773
-0.1
-0.2%
1 gen 1991 anni
51.449
+0.677
1.33%
1 gen 1992 anni
52.169
+0.72
1.4%
1 gen 1993 anni
52.267
+0.097
0.19%
1 gen 1994 anni
53.107
+0.841
1.61%
1 gen 1995 anni
52.979
-0.128
-0.24%
1 gen 1996 anni
53.215
+0.235
0.44%
1 gen 1997 anni
53.541
+0.326
0.61%
1 gen 1998 anni
53.666
+0.125
0.23%
1 gen 1999 anni
53.946
+0.28
0.52%
1 gen 2000 anni
54.978
+1.031
1.91%
1 gen 2001 anni
55.658
+0.68
1.24%
1 gen 2002 anni
57.257
+1.599
2.87%
1 gen 2003 anni
58.255
+0.998
1.74%
1 gen 2004 anni
59.077
+0.822
1.41%
1 gen 2005 anni
59.696
+0.619
1.05%
1 gen 2006 anni
61.465
+1.769
2.96%
1 gen 2007 anni
63.497
+2.033
3.31%
1 gen 2008 anni
63.549
+0.052
0.08%
1 gen 2009 anni
64.232
+0.682
1.07%
1 gen 2010 anni
66.675
+2.443
3.8%
1 gen 2011 anni
68.922
+2.247
3.37%
1 gen 2012 anni
69.748
+0.826
1.2%
1 gen 2013 anni
70.91
+1.162
1.67%
1 gen 2014 anni
71.022
+0.112
0.16%
1 gen 2015 anni
71.675
+0.654
0.92%
Classificazione dei paesi secondo i statistiche attuali per anni


Commenti: